Science Highlights
Spatial association between an active region jet and a nonthermal type III radio burst
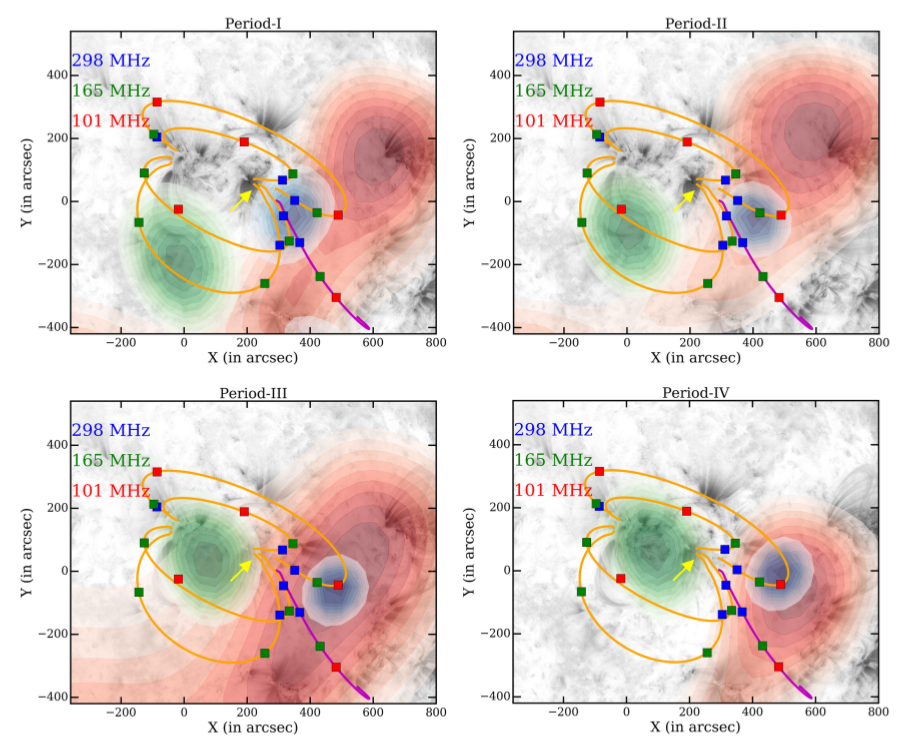
Mulay et al. have used extreme UV imaging data from the AIA/SDO, radio imaging and spectra from the Murchison Widefield Array (MWA), and photospheric magnetic data from the HMI/SDO to carry out a detailed investigation of an active region jet and a nonthermal type III radio burst. The temperature of the jet spire and the footpoint regions were found to be similar to those reported in similar earlier studies, though the lower limits to the densities in these regions were estimated to be about an order of magnitude lower than the values reported earlier. A temporal and spatial correlation between the active region jet and the type III burst was established using high time resolution spectroscopic radio imaging. Observations of type III bursts are often used to establish the presence of open field lines. In the present instance, the MWA observations probe the regions ~0.13-0.52 R_Sun above the photosphere. A detailed examination of the data reveals that the nature of the observed radio emission is rather complex. A very interesting aspect of this work is that the observed and expected locations (based on the standard magnetic field extrapolation techniques) of radio burst sources do not match. The radio emission is very dynamic, changing across frequencies, and the differences between observed and expected emissions do not seem to follow a systematic pattern. A part of the observed differences can be explained by invoking the presence of significant propagation effects (refraction and scattering), which, in turn, provide evidence for large and dynamic density coronal inhomogeneities. The accompanying figure shows an AIA 171 Angstrom image at 03:51:47 UT with the red, green, and blue contours plotted over it (50, 55, 60, 65, 70, 75, 80, 85, 90, and 95% of the peak of the flux) representing observations at 101, 165, and 298 MHz, respectively. The yellow arrow indicates the location of the jet eruption. Orange and magenta lines indicate closed and open field lines, respectively, as given by extrapolation models. The red, green, and blue squares show the expected locations of radio sources at 101, 165, and 298 MHz, respectively. The different panels show the radio emission during each of the four episodes type III bursts, spanning a period of about 12 min.
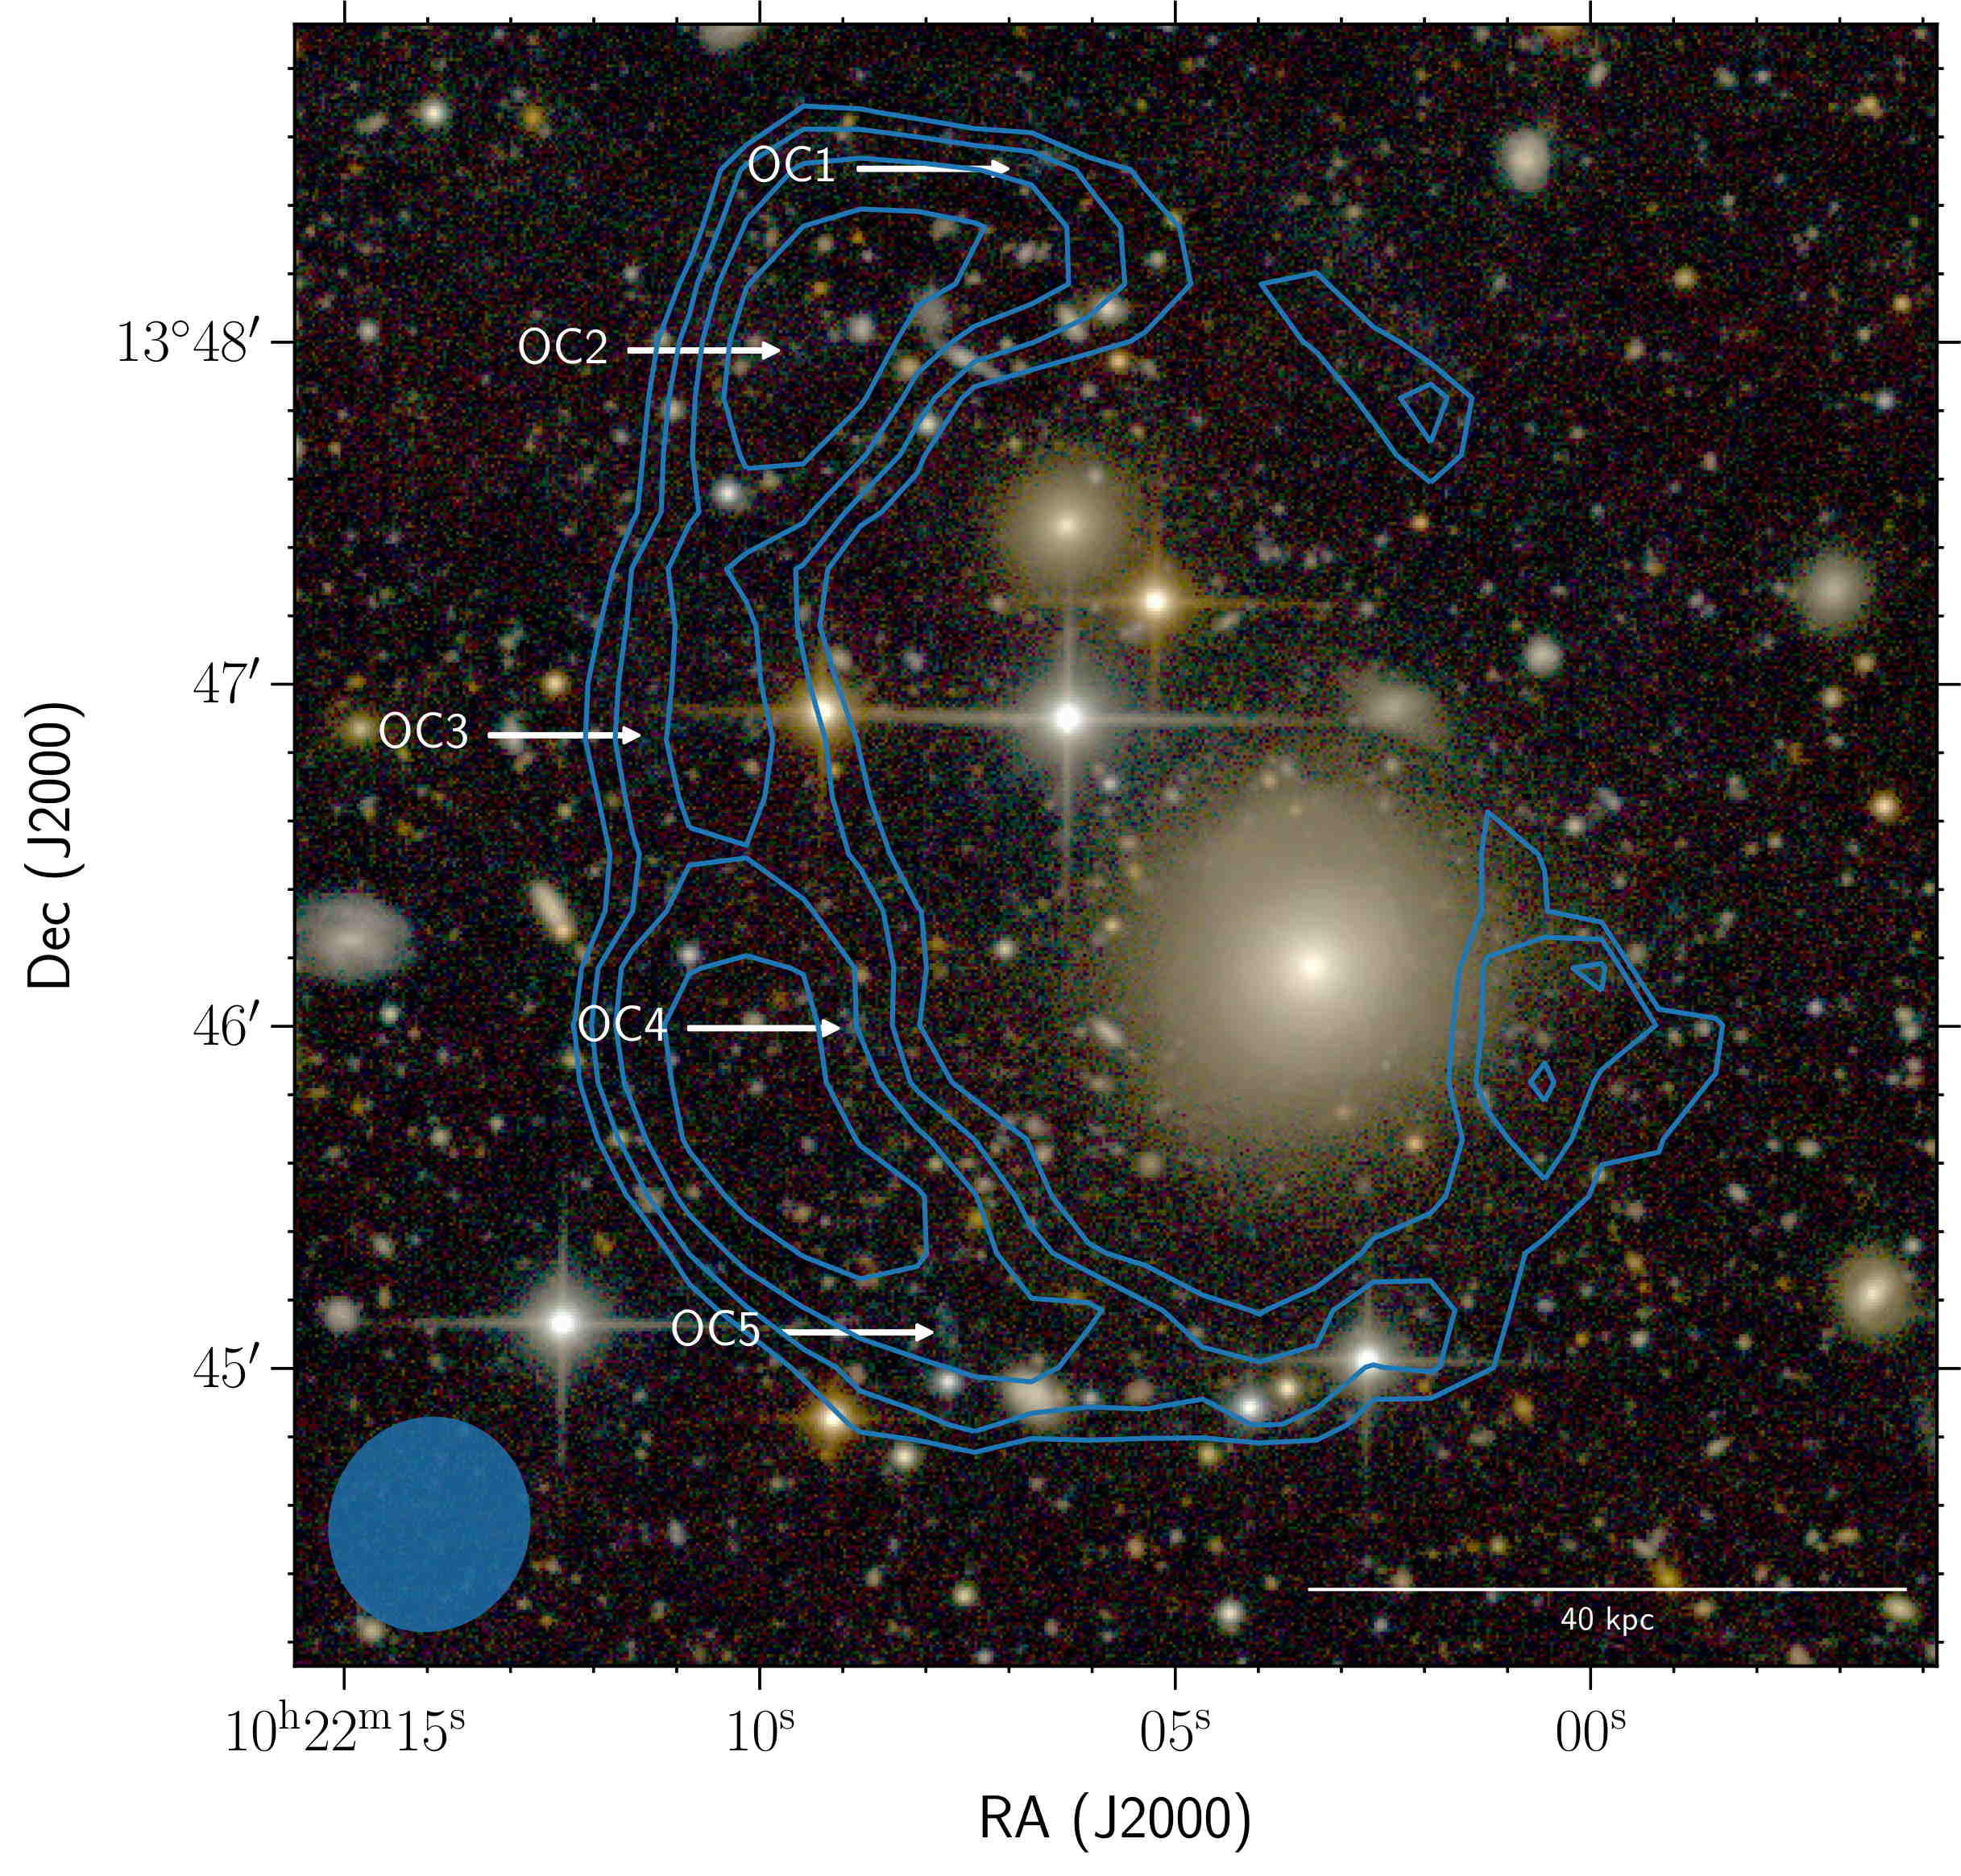
Discovery of a large HI ring around the quiescent galaxy AGC 203001
Bait et al. report the discovery using the Giant Metrewave Radio Telescope of an extremely large (diameter approximately 115 kpc) neutral hydrogen (HI) ring, off-centred from a massive quenched galaxy, AGC 203001. The ring does not have a bright extended optical counterpart unlike several other known ring galaxies. Bait et al. present deep g-, r-, and i-band optical imaging of the HI ring, using the MegaCam instrument on the Canada-France-Hawaii Telescope, which shows several regions with faint optical emission at a surface brightness level of approximately 28 mag. per square arcsec. Such extended HI structures are rare, with only one other case known so far -- the Leo ring. Conventionally, off-centred rings have been explained by a collision with an "recentResults"intruder galaxy, leading to expanding density waves of gas and stars in the form of a ring. However, in such a scenario the impact also leads to large amounts of star formation in the ring which is not observed in the ring presented in this paper. Alternatively, such a ring could also form due to tidal interactions with a neighbouring galaxy or even major mergers. The exact physical mechanism for the formation of such rings is still under debate.
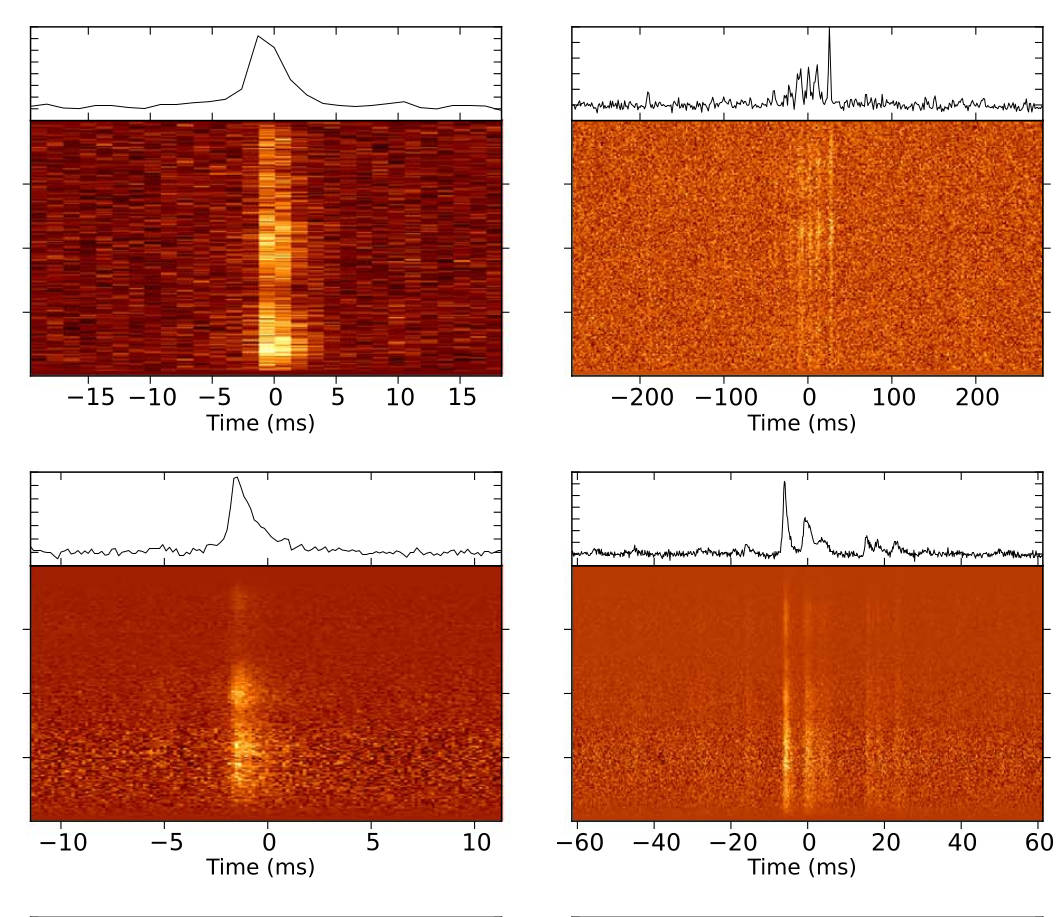
Distinct Properties of the Radio Burst Emission from the Magnetar XTE J1810-197
With their high magnetic fields, young ages, persistent but highly variable X-rays, and transient radio emission, magnetars comprise one of the exotic parts of the pulsar population. Besides understanding the radio emission mechanism itself, observational probes of several magnetar-based models of the fast radio bursts (FRBs) also highly motivate for magnetar studies at low radio frequencies. However, such studies remain challenging due to the scarcity of radio detections of magnetars as well as the transient nature of their emission. XTE J1810-197 was the first-ever magnetar which was found to emit transient radio emission. It has recently transitioned into the second known radio outburst phase. Maan et al. observed the magnetar at low radio frequencies using the GMRT, soon after the onset of its recent outburst, and reported the first detection of the source at frequencies as low as 300 MHz. The magnetar exhibits radio emission in the form of strong, narrow bursts, with a characteristic intrinsic width of the order of 0.5-0.7 ms. Maan et al. also found that the bursts exhibit spectral structures which cannot be explained by interstellar propagation effects. These structures might indicate a phenomenological link with the repeating FRBs, which also show interesting, more detailed, frequency structures. A sample of the magnetar bursts demonstrating the spectral as well as temporal structures is shown in the accompanied figure. To probe any physical link between the bursts of the magnetar and the repeating FRBs, as well as to understand the underlying emission mechanism, the magnetar is currently being monitored using the GMRT.
The GMRT High Resolution Southern Sky Survey for pulsars and transients -II. New discoveries, timing and polarization properties
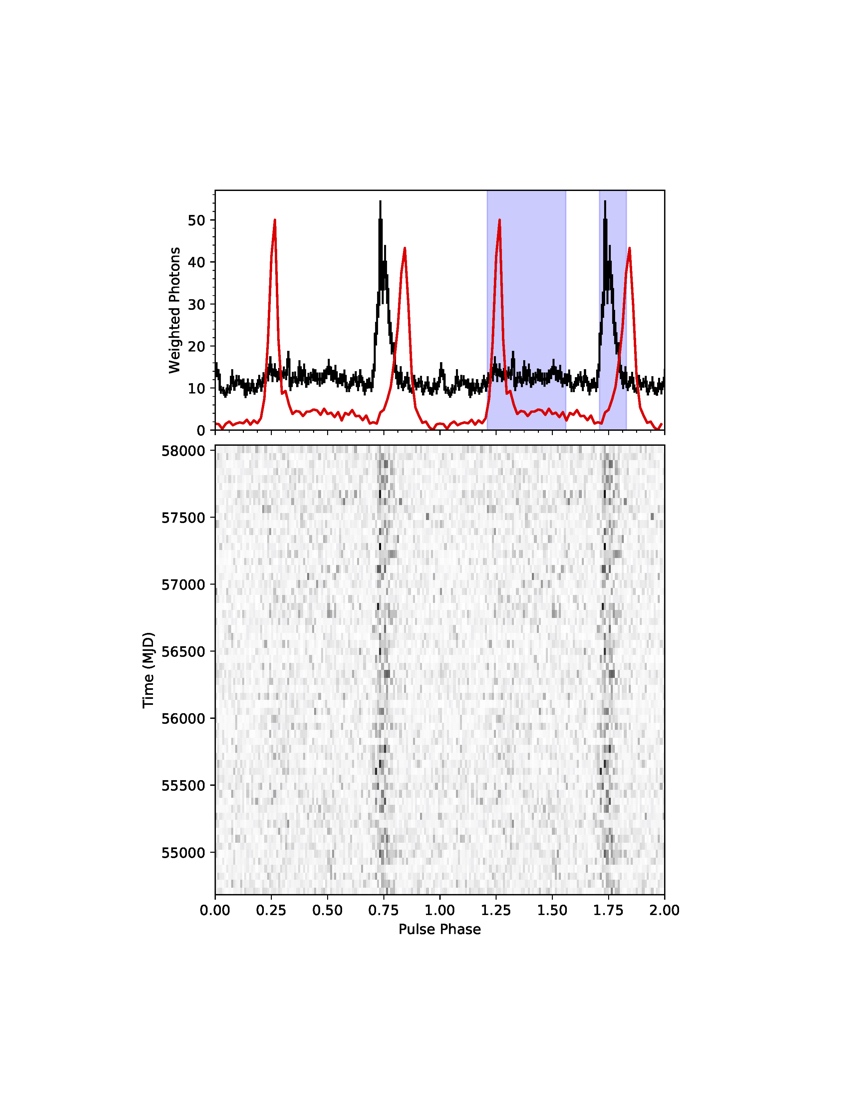
Bhattacharyya et al. have been carrying out the GMRT High Resolution Southern Sky (GHRSS) Survey for pulsars and transients since 2014. In this paper, they report the discovery of three pulsars, PSRs J1239−48, J1516−43 and J1726−52. They also present long-term timing solutions for three pulsars previously discovered with the GHRSS survey: (1) PSR J2144−5237, a millisecond pulsar with a period of 5 milli-seconds in a 10-day orbit around a companion of mass 0.18 solar masses, (2) PSR J1516−43, a mildly recycled 36 milli-second pulsar in a 228 day orbit with a companion of mass ∼0.4 solar masses, and (3) the 320 millisecond pulsar PSR J0514−4408. For PSR J0514−4408, Bhattacharyya et al. discover pulsed gamma-ray emission. In addition, they report radio polarimetric observations with the Parkes telescope for three of the GHRSS discoveries, PSRs J0418−4154, J0514−4408 and J2144−5237. The top panel of the figure shows a 322 MHz radio profile (red) of PSR J0514−4408 (discovered in the GHRSS survey) plotted with the Fermi Large Area Telescope (LAT) gamma−ray profile (using ∼9.2 years of LAT data above 100 MeV). The bottom panel of the figure shows the gamma-ray pulsation from PSR J0514−4408.
Long Term Variability of a Black Widow s Eclipses - A Decade of PSR J2051-0827
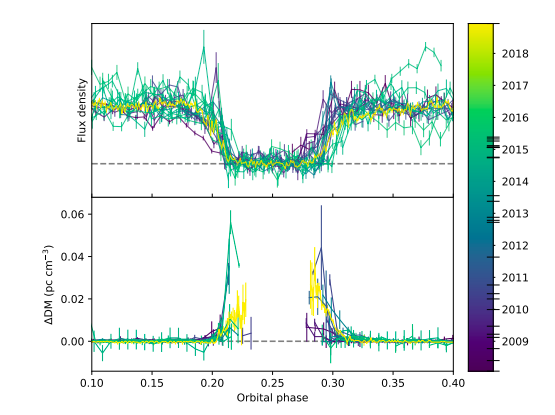
Polzin et al. report on ~ 10 yr of observations of PSR J2051-0827, a millisecond pulsar in special evolutionary state, at radio frequencies in the range 110 - 4032 MHz. They investigate the eclipse phenomena of this black widow pulsar using model fits of increased dispersion and scattering of the pulsed radio emission as it traverses the eclipse medium. No clear patterns are found between the low-frequency eclipse widths, orbital period variations, and trends in the intra-binary material density. Using polarization calibrated observations Polzin et al. present the first available limits on the strength of magnetic fields within the eclipse region of this system; the average line of sight field is constrained to lie in the range 0.0001 - 100 G, while for the case of a field directed near-perpendicular to the line of sight we find the perpendicular component of the field to be <~ 0.3 G. The results are considered in the context of eclipse mechanisms, and Polzin et al. find scattering and/or cyclotron absorption provide the most promising explanation, while dispersion smearing is conclusively ruled out. Finally, Polzin et al. estimate the mass-loss rate from the companion to be ~ 10^{-12} solar masses per year suggesting that the companion will not be fully evaporated on any reasonable time-scale. The top panel of the figure shows measured flux densities for all 345 MHz observations covering the eclipse region, with each normalised so that the out-of eclipse mean flux density is unity. The horizontal dashed line corresponds to the detection limit of the telescope. The bottom panel of the figure shows the deviation from mean out-of-eclipse dispersion measures for the same set of observations.
Super-giant Pulses from the Crab Pulsar: Energy distribution and Occurrence rate
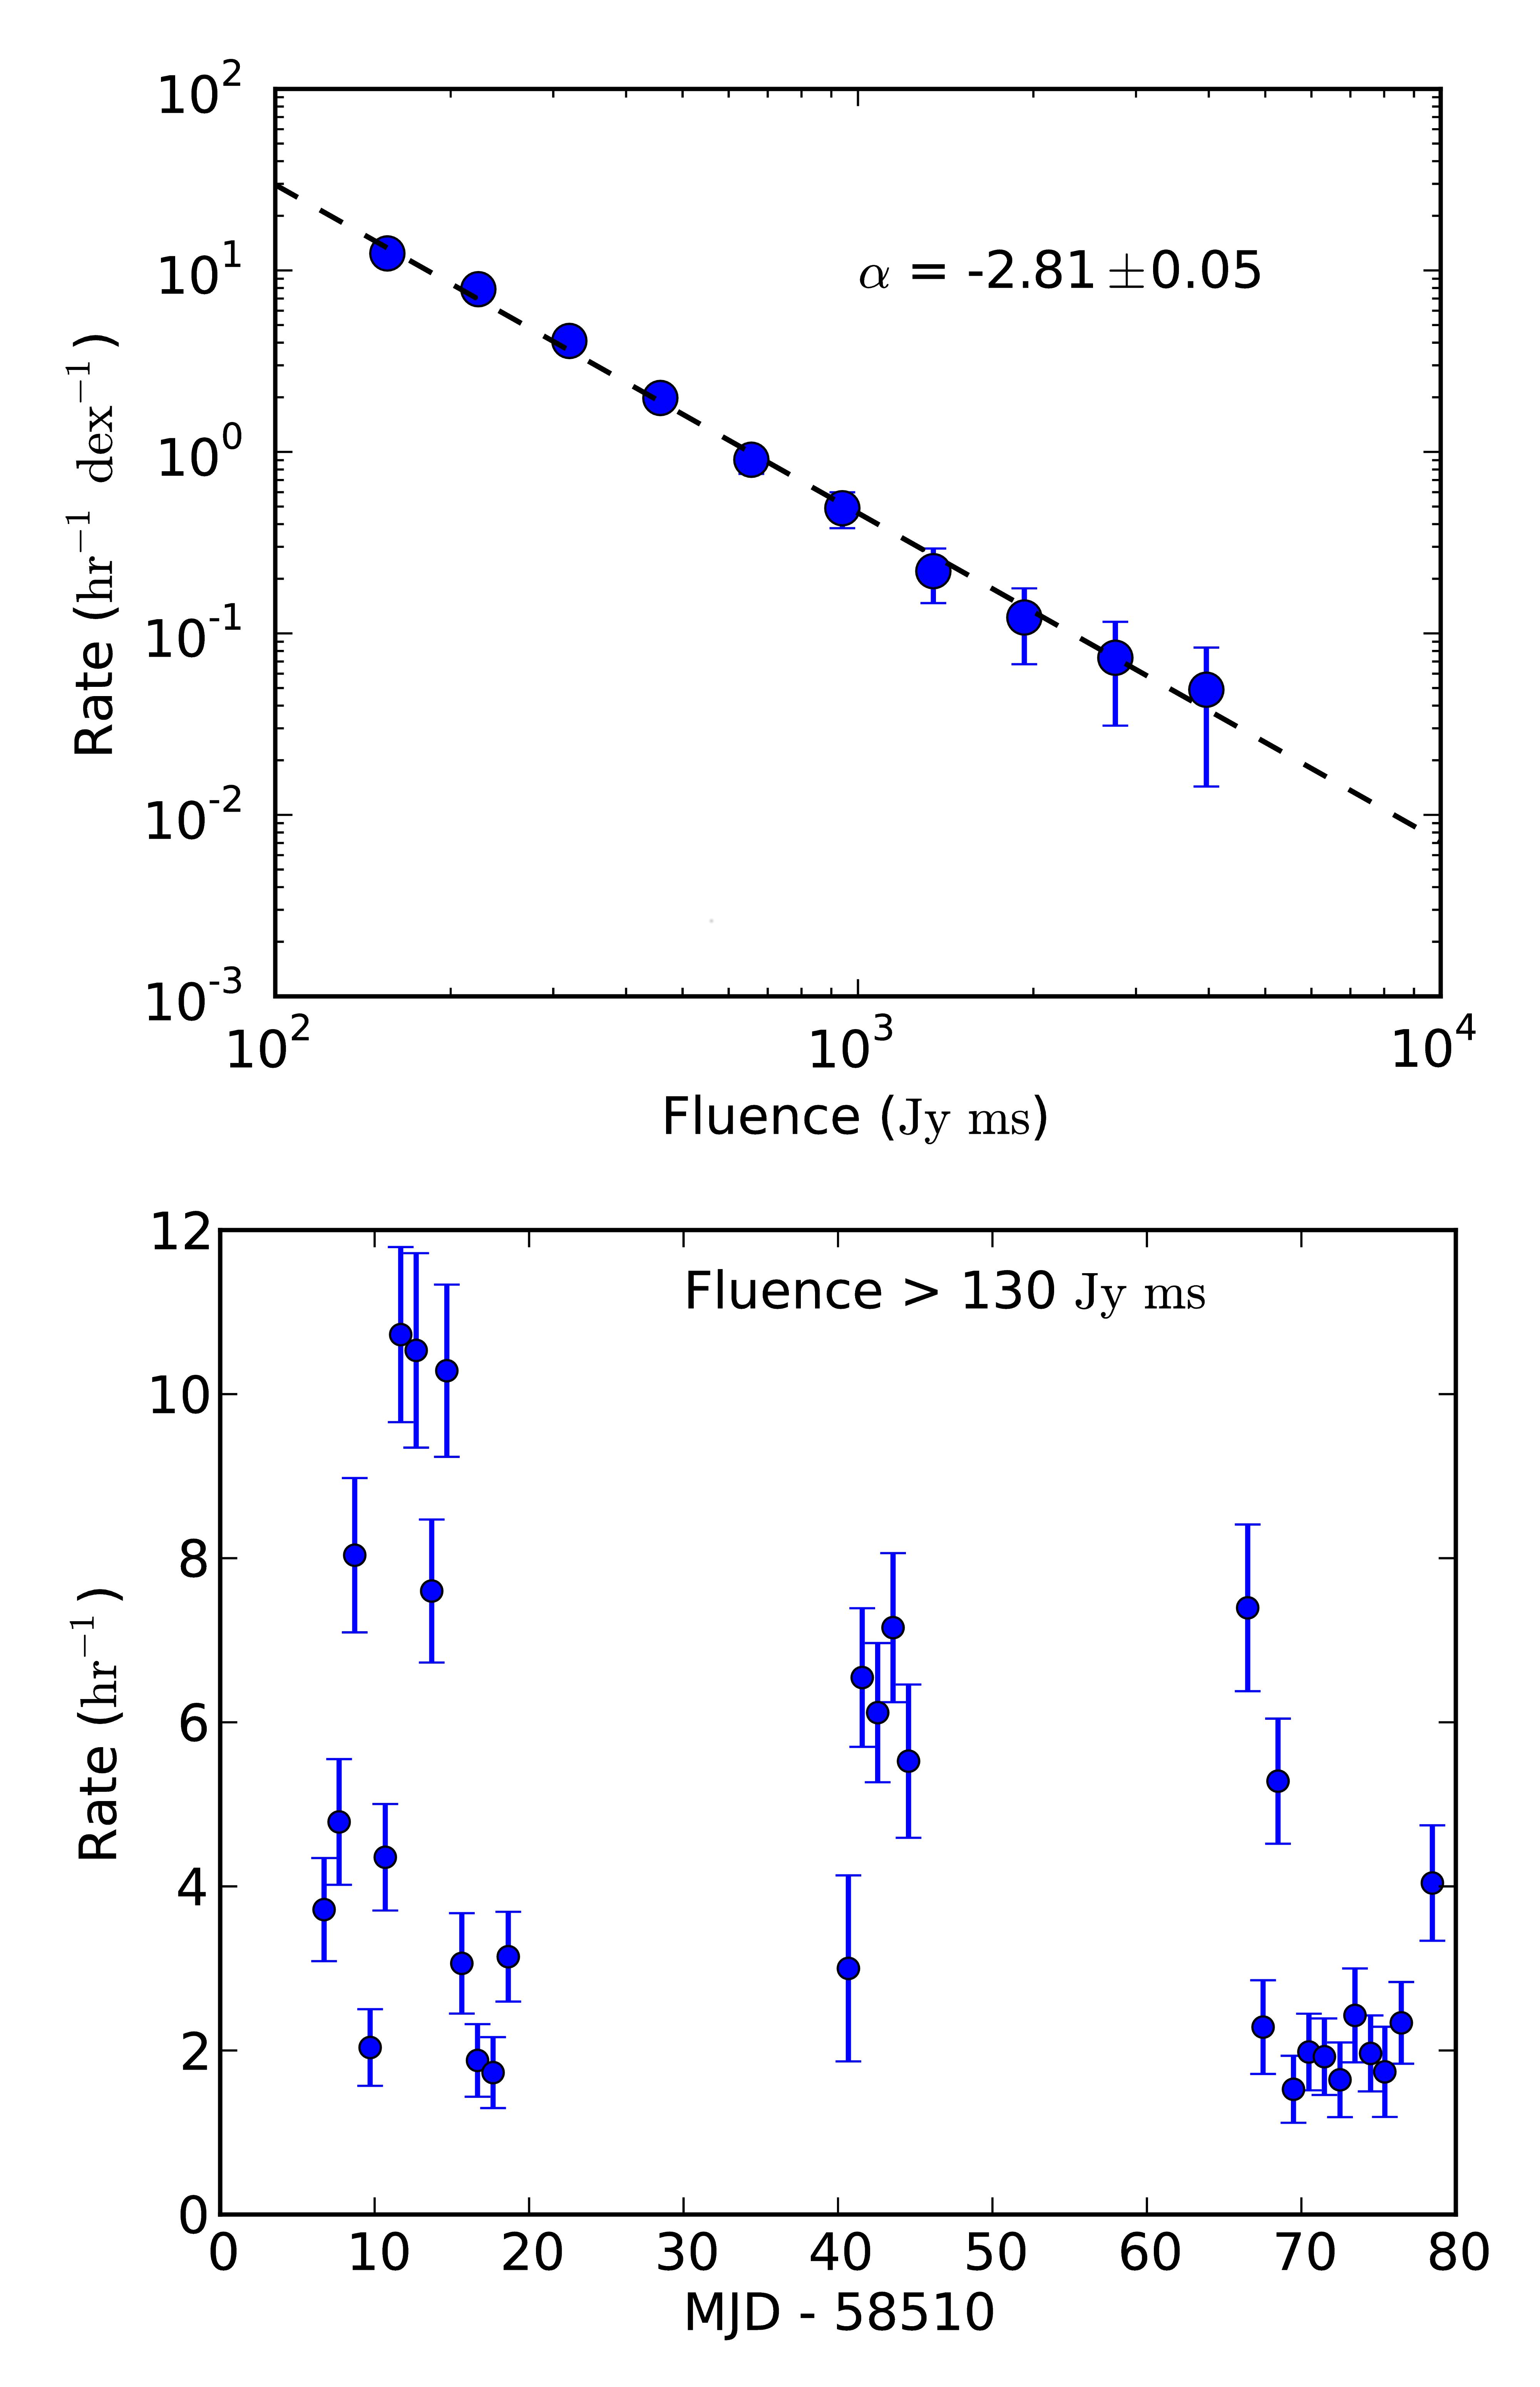
The young pulsar residing inside the Crab nebula is not only one of the handful of pulsars known to emit giant radio pulses, but also the most frequent giant pulse emitter among them. The giant pulses emitted by the Crab pulsar reach pulse energies (flux density integrated over the pulse duration) as large as a few million times higher than the energies of the regular pulses. Statistical properties of the Crab giant pulses have been studied by a number of researchers in the past and it has been found that the energy distribution of the giant pulses is well described by a power law in contrast with that of the regular pulses which follows a log-normal or an exponential distribution. This indicates that the regular and giant pulses are likely to arise from different physical mechanisms. Although giant pulses have been observed to have pulse-energies up to ~1000 Jy ms at frequencies ~1.4 GHz, the relative rarity of the brighter pulses (in typically a few hours of observation) have restricted statistical studies to energies up to around 30 Jy ms. The brightest giant pulses, sometimes termed as the super-giant pulses, have recently become more interesting after the discovery of fast radio bursts (FRBs), which are short intense bursts of radio emission from unknown extragalactic sources. While a few FRBs have been observed to repeat, most of them are still not known to be repeating. Super-giant pulses from Crab-like pulsars in other galaxies have been suggested as a possible origin of the FRBs. Bera and Chengalur observed the Crab pulsar with the NCRA-15m telescope for ~260 hours in 31 observing sessions spanning ~45 days, and detected 1799 super-giant pulses with pulse-energies > 100 Jy ms at an observing frequency of 1.3 GHz. This is the largest sample of giant pulses with pulse-energies > 100 Jy ms at these frequencies, facilitating a statistical study of giant pulses up to pulse energies of ~3000 Jy ms, two orders of magnitude larger than energy ranges probed in similar earlier studies. The sample also contains one of the brightest giant pulses ever observed from the Crab pulsar, with peak flux density > 4 MJy and pulse energy ~4700 Jy ms. Bera and Chengalur studied the statistical properties of a sub-sample of 1153 super-giant pulses complete down to a pulse energy of 130 Jy ms and compared the distribution to that of the currently known FRBs. They find that the pulse-energy distribution (shown in the top panel of the figure) of giant pulses of the Crab pulsar follows a single power law, with power-law index approximately -3, over at least three orders of magnitude in pulse energy, from ~3 Jy ms to ~3000 Jy ms. The power-law index is in excellent agreement with that found for one of the repeating FRBs (FRB 121102). Bera and Chengalur also find that the rate of occurrence of super-giant pulses varies by a factor of approximately 5 on time scales of a few days (shown in the bottom panel of the figure), although the pulse-energy distribution remains the same within the uncertainties in both the \"active\" and \"passive\" phases (with relatively high and low rates of occurrence). This varying rate of pulse emission has also been seen for the repeating FRB, FRB 121102. Although the pulse energy of the brightest known super-giant pulse in this sample is still smaller than the inferred pulse energies of the FRBs by a few orders of magnitude, the similarities in the statistical properties suggest that super-giant pulses could be a viable model for repeating FRBs, requiring extremely young pulsars or magnetars (pulsars with extremely high magnetic fields) to explain the observed high pulse energies.
Radio Continuum Emission from Local Analogs of High-redshift Lyman-alpha emitters
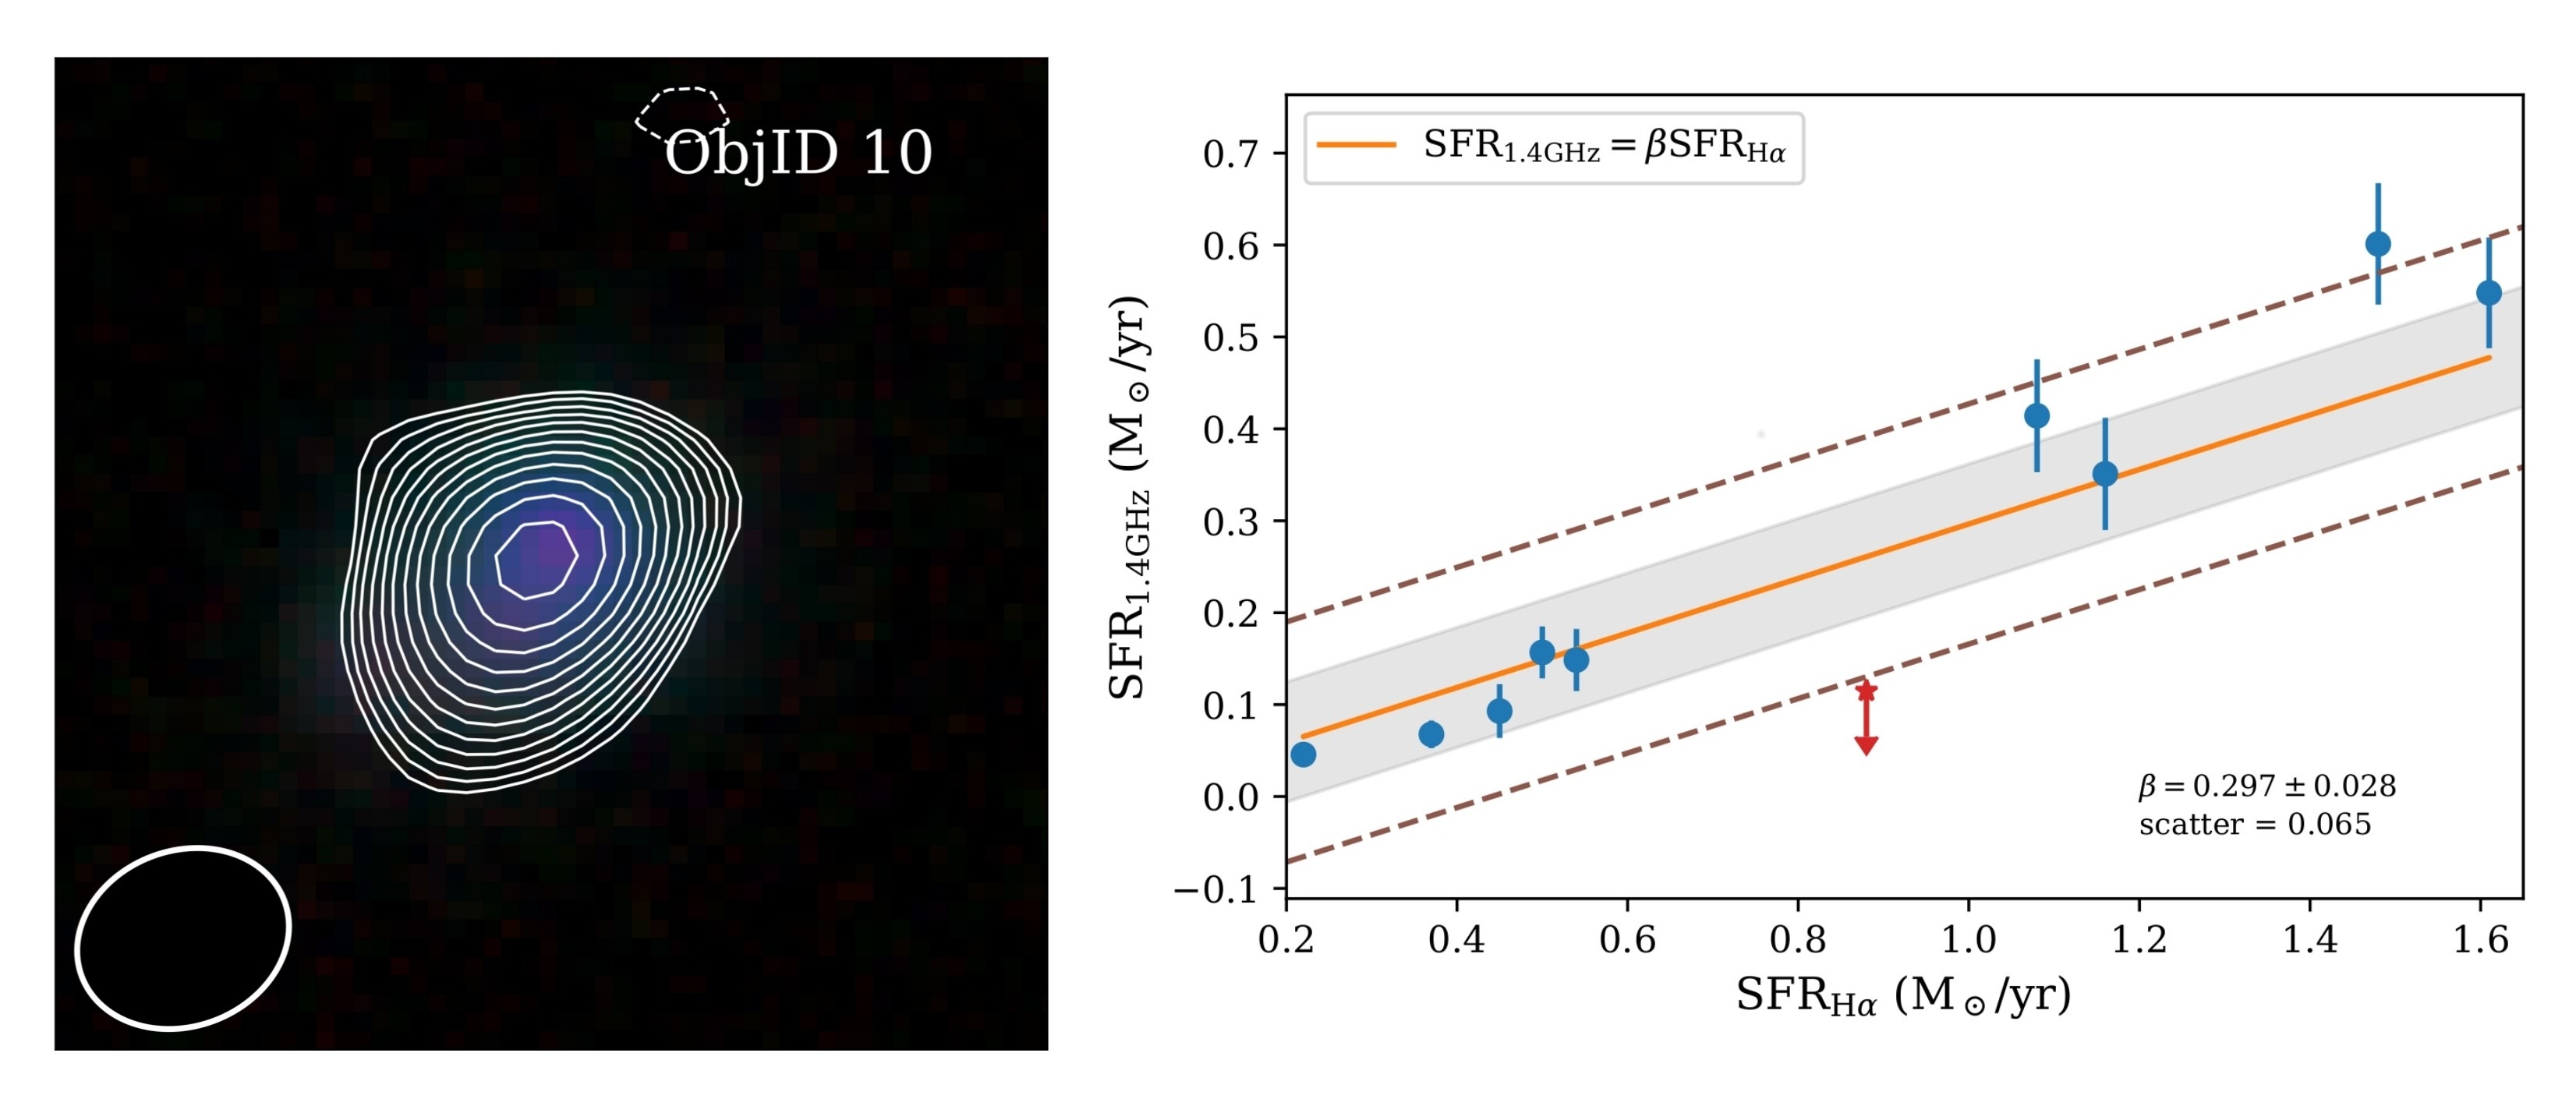
Blueberry galaxies are the low-redshift faint counterparts of the recently discovered class of Green Pea galaxies. These galaxies are often considered to be the local analogs of the high-redshift Ly-alpha emitters, which are thought to have contributed to the reionization of the Universe. Sebastian and Bait observed ten of the brightest blueberry galaxies from the sample of Yang et al. (2017), using the upgraded Giant Metrewave Radio Telescope (uGMRT) at 1.25 GHz. Nine of the blueberries were detected in the uGMRT continuum images. However, the 1.25 GHz continuum flux densities were lower by a factor of approximately 3.4 compared to the values expected from scaling relations obtained from normal star-forming galaxies. Possible explanations for the lower radio flux densities in blueberries include a deficit of cosmic ray electrons (CREs) or low values of magnetic fields due to the young ages of these galaxies and the escape of the CREs via diffusion or outflows; it is not possible to distinguish between these models with the current data. Sebastian and Bait also calculated the value of magnetic fields in the blueberries, and found that, despite their young ages, the blueberries show magnetic fields that are larger than those seen in galaxies with large-scale ordered rotation. They hence suggest that small-scale dynamo mechanisms play an important role in the magnetic field amplification in blueberry galaxies. The left panel of the figure shows the uGMRT 1.25 GHz image (in contours) of one of the blueberry galaxies, overlaid on an optical grz-band colour composite image. The right panel shows the star formation rates (SFRs) derived from the uGMRT radio continuum flux densities for the 9 blueberries plotted against the SFRs derived from H-alpha emission; it is clear that the radio SFRs are significantly lower than the H-alpha SFRs, by a factor of around 3.
A weak coronal heating event associated with periodic particle acceleration episodes
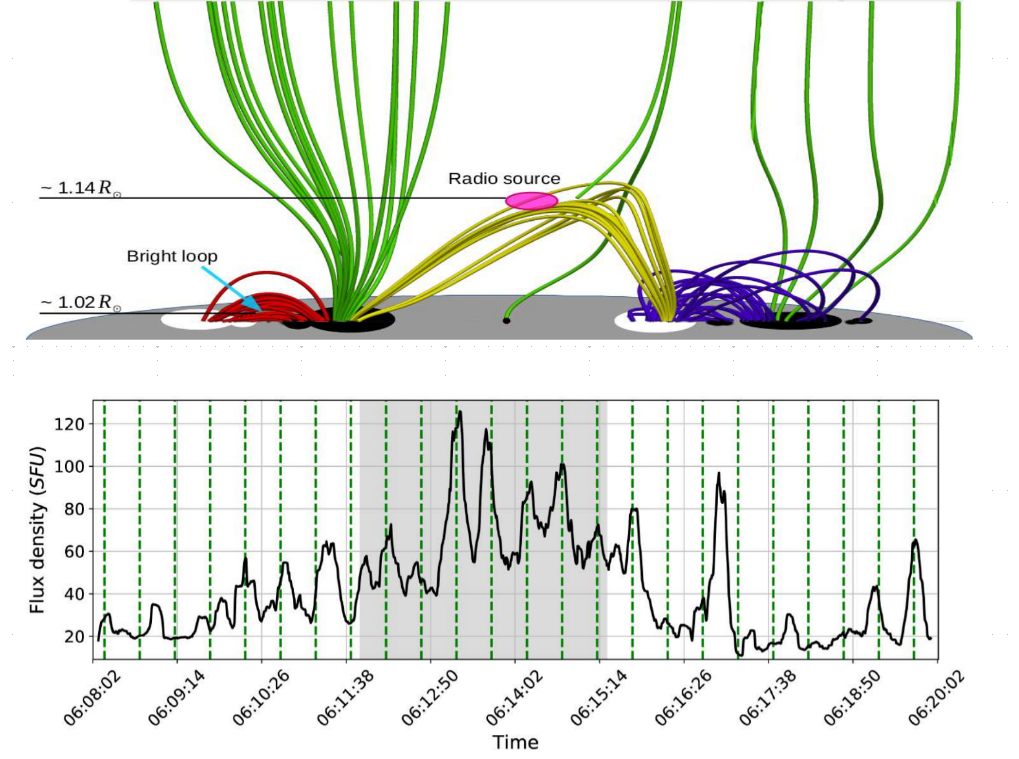
Weak heating events are frequent and ubiquitous in the solar corona. They derive their energy from the local magnetic field and form a major source of local heating, signatures of which are seen in extreme UV (EUV) and X-ray bands. Associated radio emission arises from various plasma instabilities that lead to coherent radiation, making even a weak X-ray flare appear very bright in metrewave radio bands. Radio observations can hence probe non-equilibrium dynamics, providing complementary information about plasma evolution. However, a robust study of radio emission from one weak event among many simultaneous events, requires high dynamic range imaging at sub-second and sub-MHz resolutions due to the high spectro-temporal variability of these emissions. Such observations were not possible until recently. Mohan et al. present the first spectroscopic radio imaging study of a type-I noise storm, the data for which were obtained using the Murchison Widefield Array. This is also among the first spatially-resolved multi-waveband studies of active region loops hosting transient brightenings (ARTB), which are shown to be dynamically linked to metrewave type-I noise storms. Mohan et al. report the discovery of 30-second quasi-periodic oscillations (QPOs) in the radio light curve, riding on a baseline flux density. The strength of the QPOs and the baseline flux density are enhanced during a mircoflare associated with the ARTB. The interpretation suggested by Mohan et al. is that the sub-photospheric convective plasma flows lead to a build-up of magnetic stress across the braided magnetic field network. This stress gets released via numerous weak magnetic reconnection events. The observed relaxation time scale of 30 seconds corresponds to the Alfvén timescale for a the observed magnetic field braiding length scale. In the figure, the top panel shows the physical picture emerging from this study. The EUV bright loops are shown in red, and are co-located with the X-ray source. The observed radio emission comes from the marked region along the yellow loops at much larger coronal heights. The bottom panel shows the radio light curve after smoothing with a 10-second running mean filter. The vertical dashed lines are drawn at a separation of 30 seconds. The quasi-periodicity of episodes of emission is self evident.
Atomic hydrogen in star-forming galaxies at intermediate redshifts
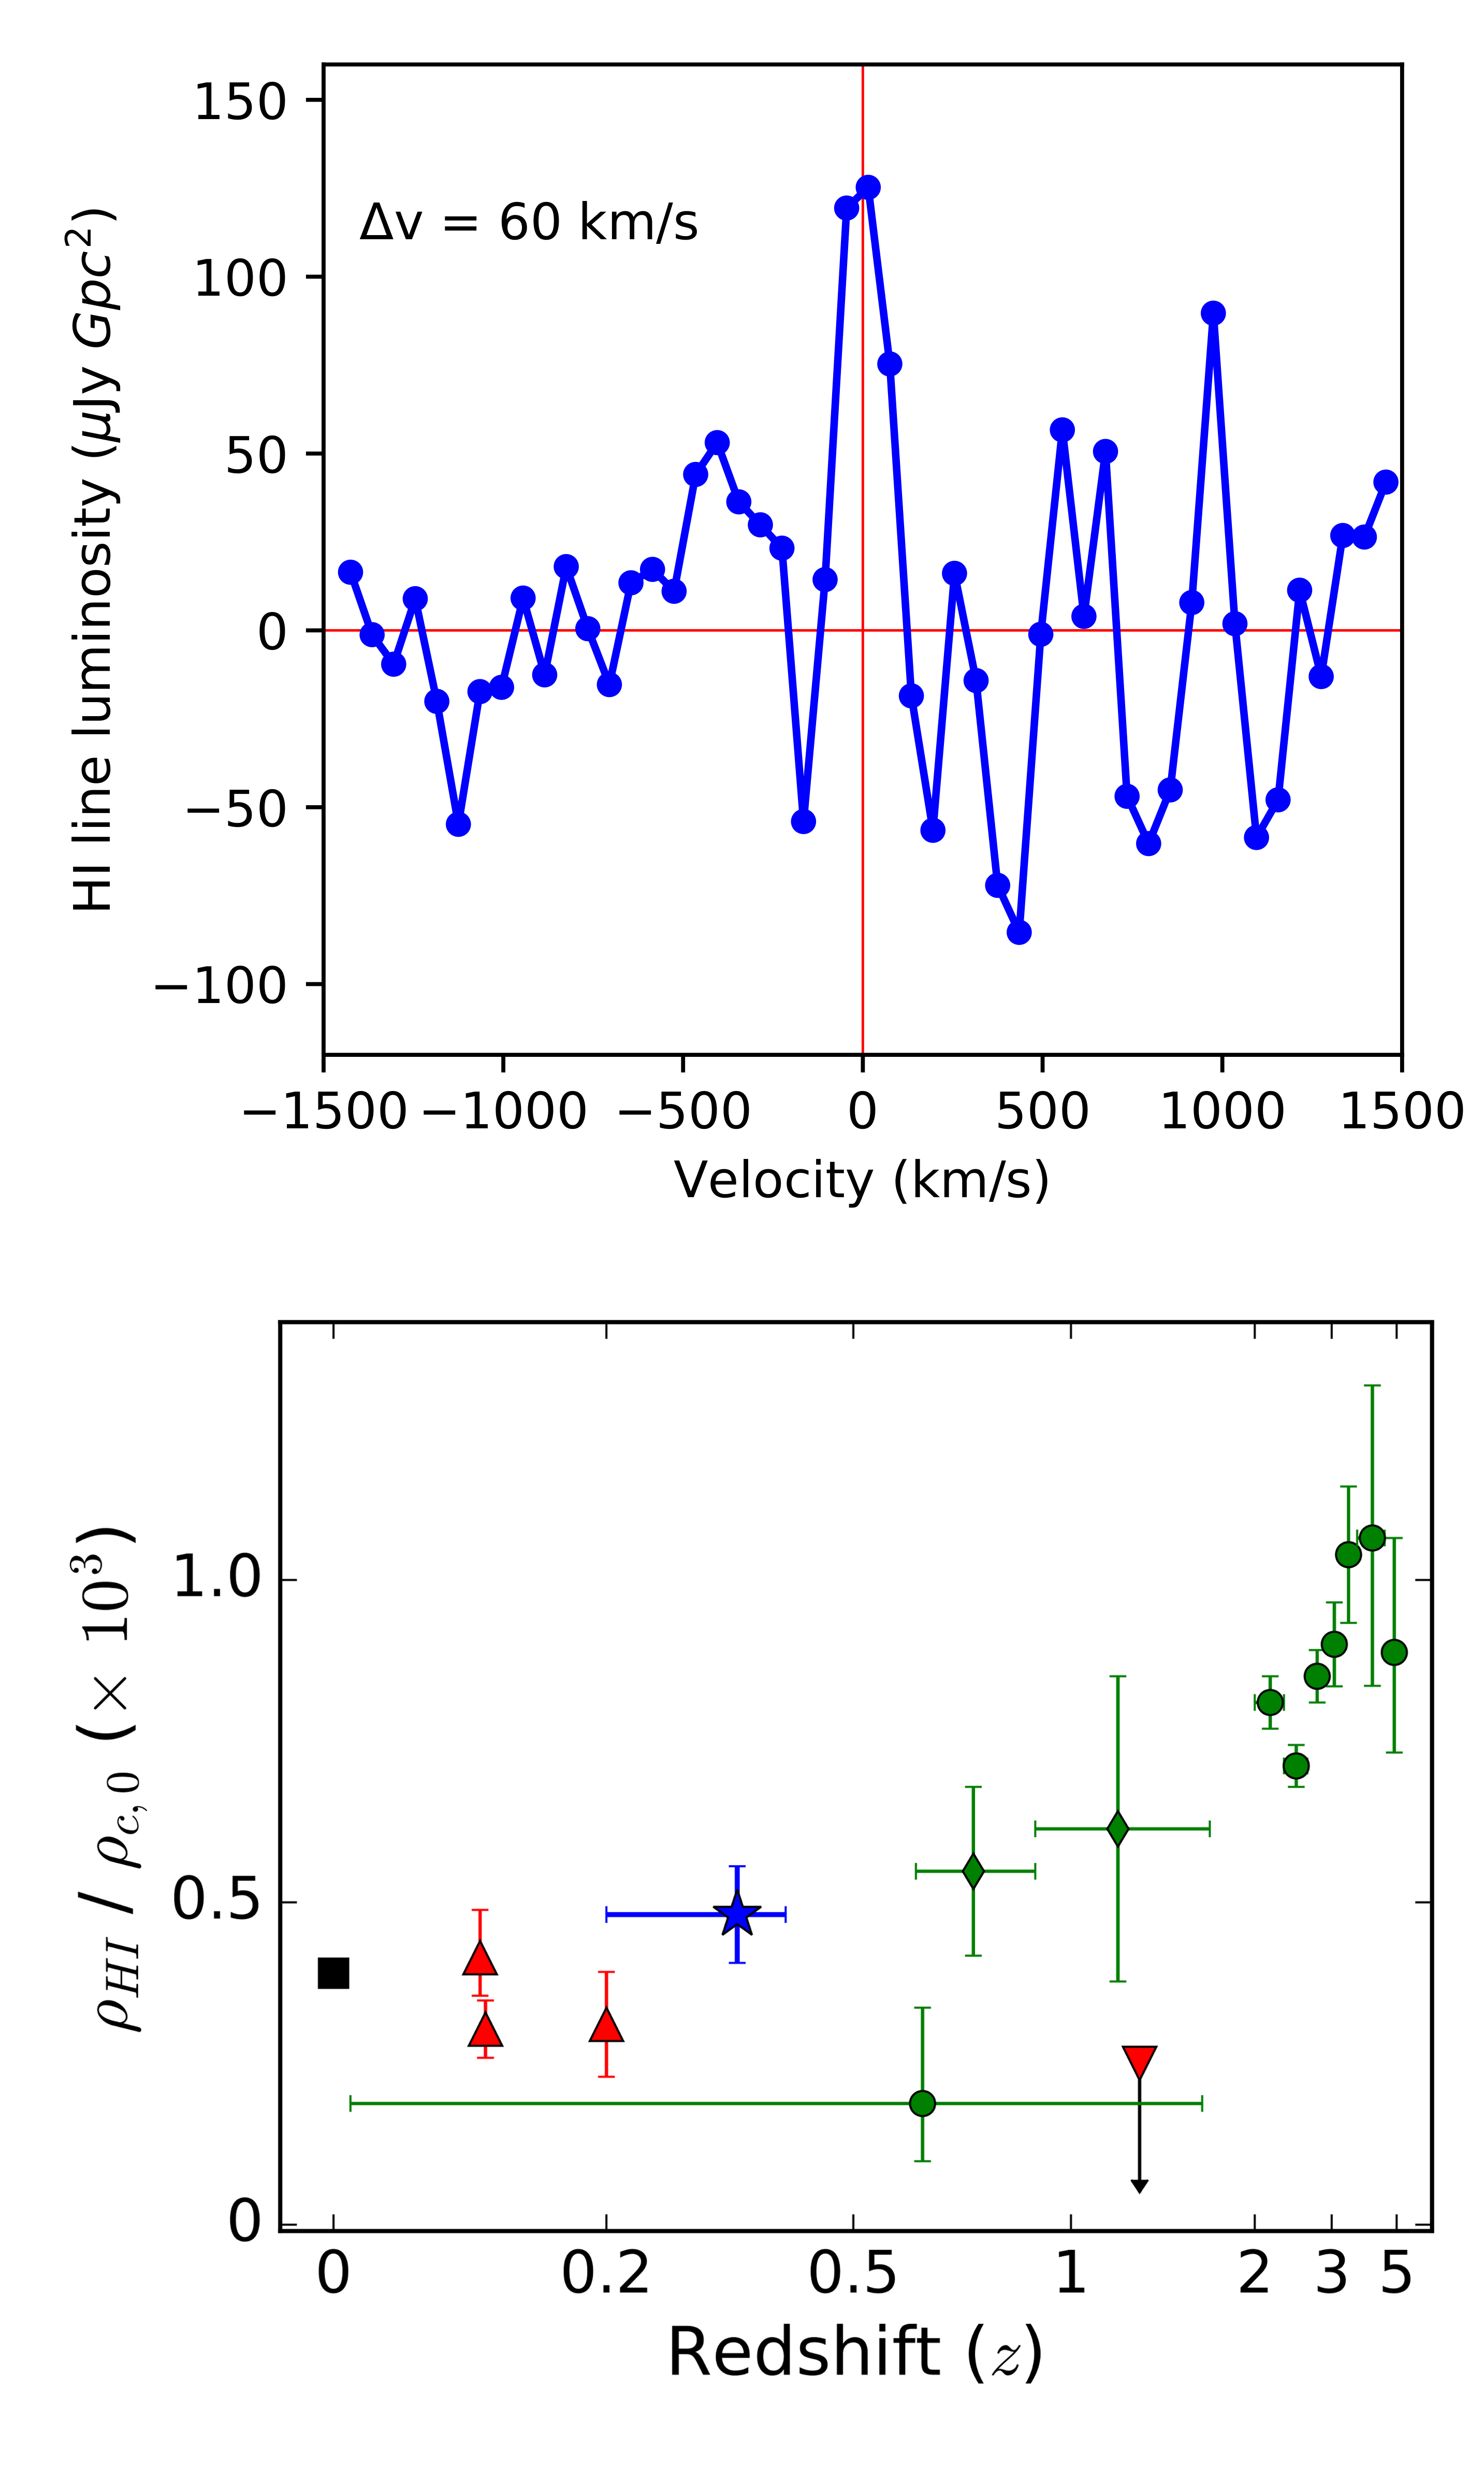
Bera et al. used the upgraded Giant Metrewave Radio Telescope to carry out a deep observation of one of the well-known optical deep fields, the Extended Groth Strip, (EGS) covering the frequency range 1000-1370 MHz. This enabled a sensitive search for the hyperfine HI 21cm line from neutral atomic hydrogen (HI) in galaxies in the EGS, in the redshift range z~0.05-0.4. Bera et al. stacked (i.e. averaged) the HI 21cm emission signals from 445 blue star-forming galaxies in the EGS at 0.2
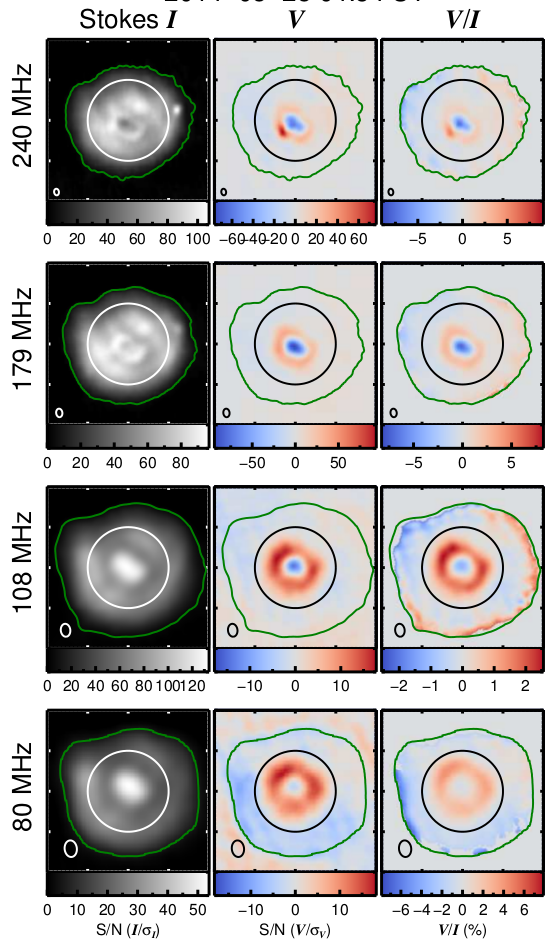
The low-frequency solar corona in circular polarisation
McCauley et al. present the first circular polarisation (Stokes V) images of the Sun from the Murchison Widefield Array (MWA). These Stokes V images span the range form 80-240 MHz and were made using a heuristic polarisation calibration algorithm introduced here. They also present a survey of Stokes V features detected in over 100 observing runs near solar maximum during quiescent periods. These include detection of around 700 compact polarised sources with polarisation fractions ranging from less than 0.5% to nearly 100%. They are interpreted to be arising from a continuum of plasma emission noise storm (type-I bursts) sources associated with active regions. They also report a curious but characteristic “bullseye†structures observed for many low-latitude coronal holes in which a central polarized component is surrounded by a ring of the opposite sense. They also show that the large-scale polarimetric structure at their lowest frequencies is reasonably well-correlated with the line-of-sight magnetic field component inferred from a global potential field source surface model, while at higher frequencies this is not observed to be the case. The figure shows an example of Stokes I, V, and V/I at four frequencies across the MWA band for a coronal hole. Color bar units are in signal-to-noise [S/N] for I and V and percent for polarization fraction [V/I]. The green contours represent the 5 sigma level in Stokes I, the solid circles represent the optical disk, and the ellipses in the lower-left corners represent the synthesized beam sizes. The coronal hole is clearly visible in the 240 MHz Stokes I images, and transitions from being a dark to a bright structure as one proceeds to lower frequencies. The corresponding Stokes V bullseye structure is self evident.