Science Highlights
High Molecular Gas Masses in Absorption-selected Galaxies at z ~ 2
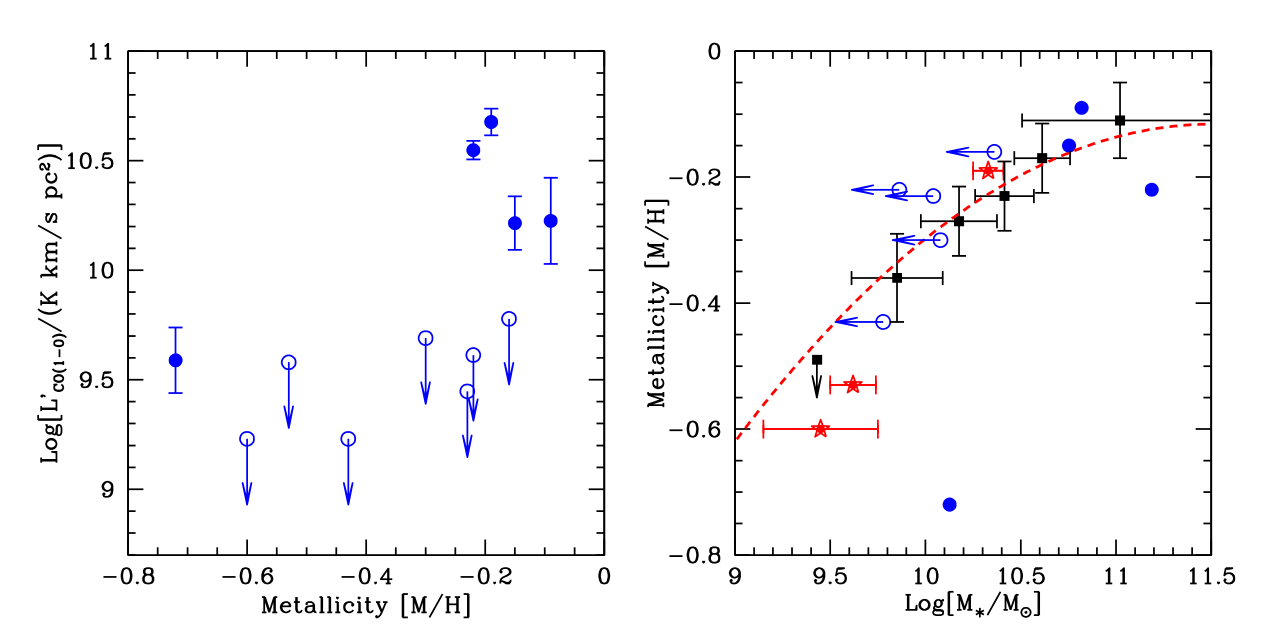
Kanekar et al. used the Atacama Large Millimeter/submillimeter Array (ALMA) to carry out a search for CO (3-2) or (4-3) emission from the fields of 12 high-metallicity damped Lyman-alpha absorbers (DLAs) at z~1.7-2.6. They detected CO emission from galaxies in the fields of five DLAs, obtaining high molecular gas masses, in the range (13 - 210) billion solar masses. The impact parameters of the CO emitters to the QSO sightline lie in the range 5.6-100 kpc, with the three new CO detections having impact parameters <~ 15 kpc. The highest CO line luminosities and inferred molecular gas masses are associated with the highest-metallicity DLAs, with metallicities within a factor of 2 of the solar metallicity. The high inferred molecular gas masses may be explained by a combination of a stellar mass-metallicity relation and a high molecular gas-to-stars mass ratio in high-redshift galaxies; the DLA galaxies identified by the authors CO searches have properties consistent with those of emission-selected samples. None of the DLA galaxies detected in CO emission were identified in earlier optical or near-IR searches and vice-versa; DLA galaxies earlier identified in optical/near-IR searches were not detected in CO emission. The high ALMA CO and [CII] 158-micron line detection rate in high-redshift, high-metallicity DLA galaxies has revolutionized the field, allowing the identification of dusty, massive galaxies associated with high-redshift DLAs. The HI-absorption criterion identifying DLAs selects the entire high-redshift galaxy population, including dusty and UV-bright galaxies, in a wide range of environments. The left panel of the figure shows the CO line luminosity (in logarithmic units) plotted against the absorber metallicity; the higher CO line luminosity at [M/H]>= -0.3 dex is clear. The right panel plots metallicity against stellar mass (assumed to be equal to the molecular gas mass), with CO detections shown as filled blue circles and CO non-detections as open blue circles. The filled black squares show the (binned) emission metallicity plotted against the (binned) stellar mass for the UV-selected galaxies of Erb et al. (2006), while the dashed red curve shows the mass-metallicity relation of these galaxies. Three DLA galaxies identified via optical spectroscopy are shown as red stars, with stellar mass estimates from the optical/near-IR photometry.
The radio emission from a decade old Type I superluminous supernova, PTF10hgi, and the fast radio burst FRB121102
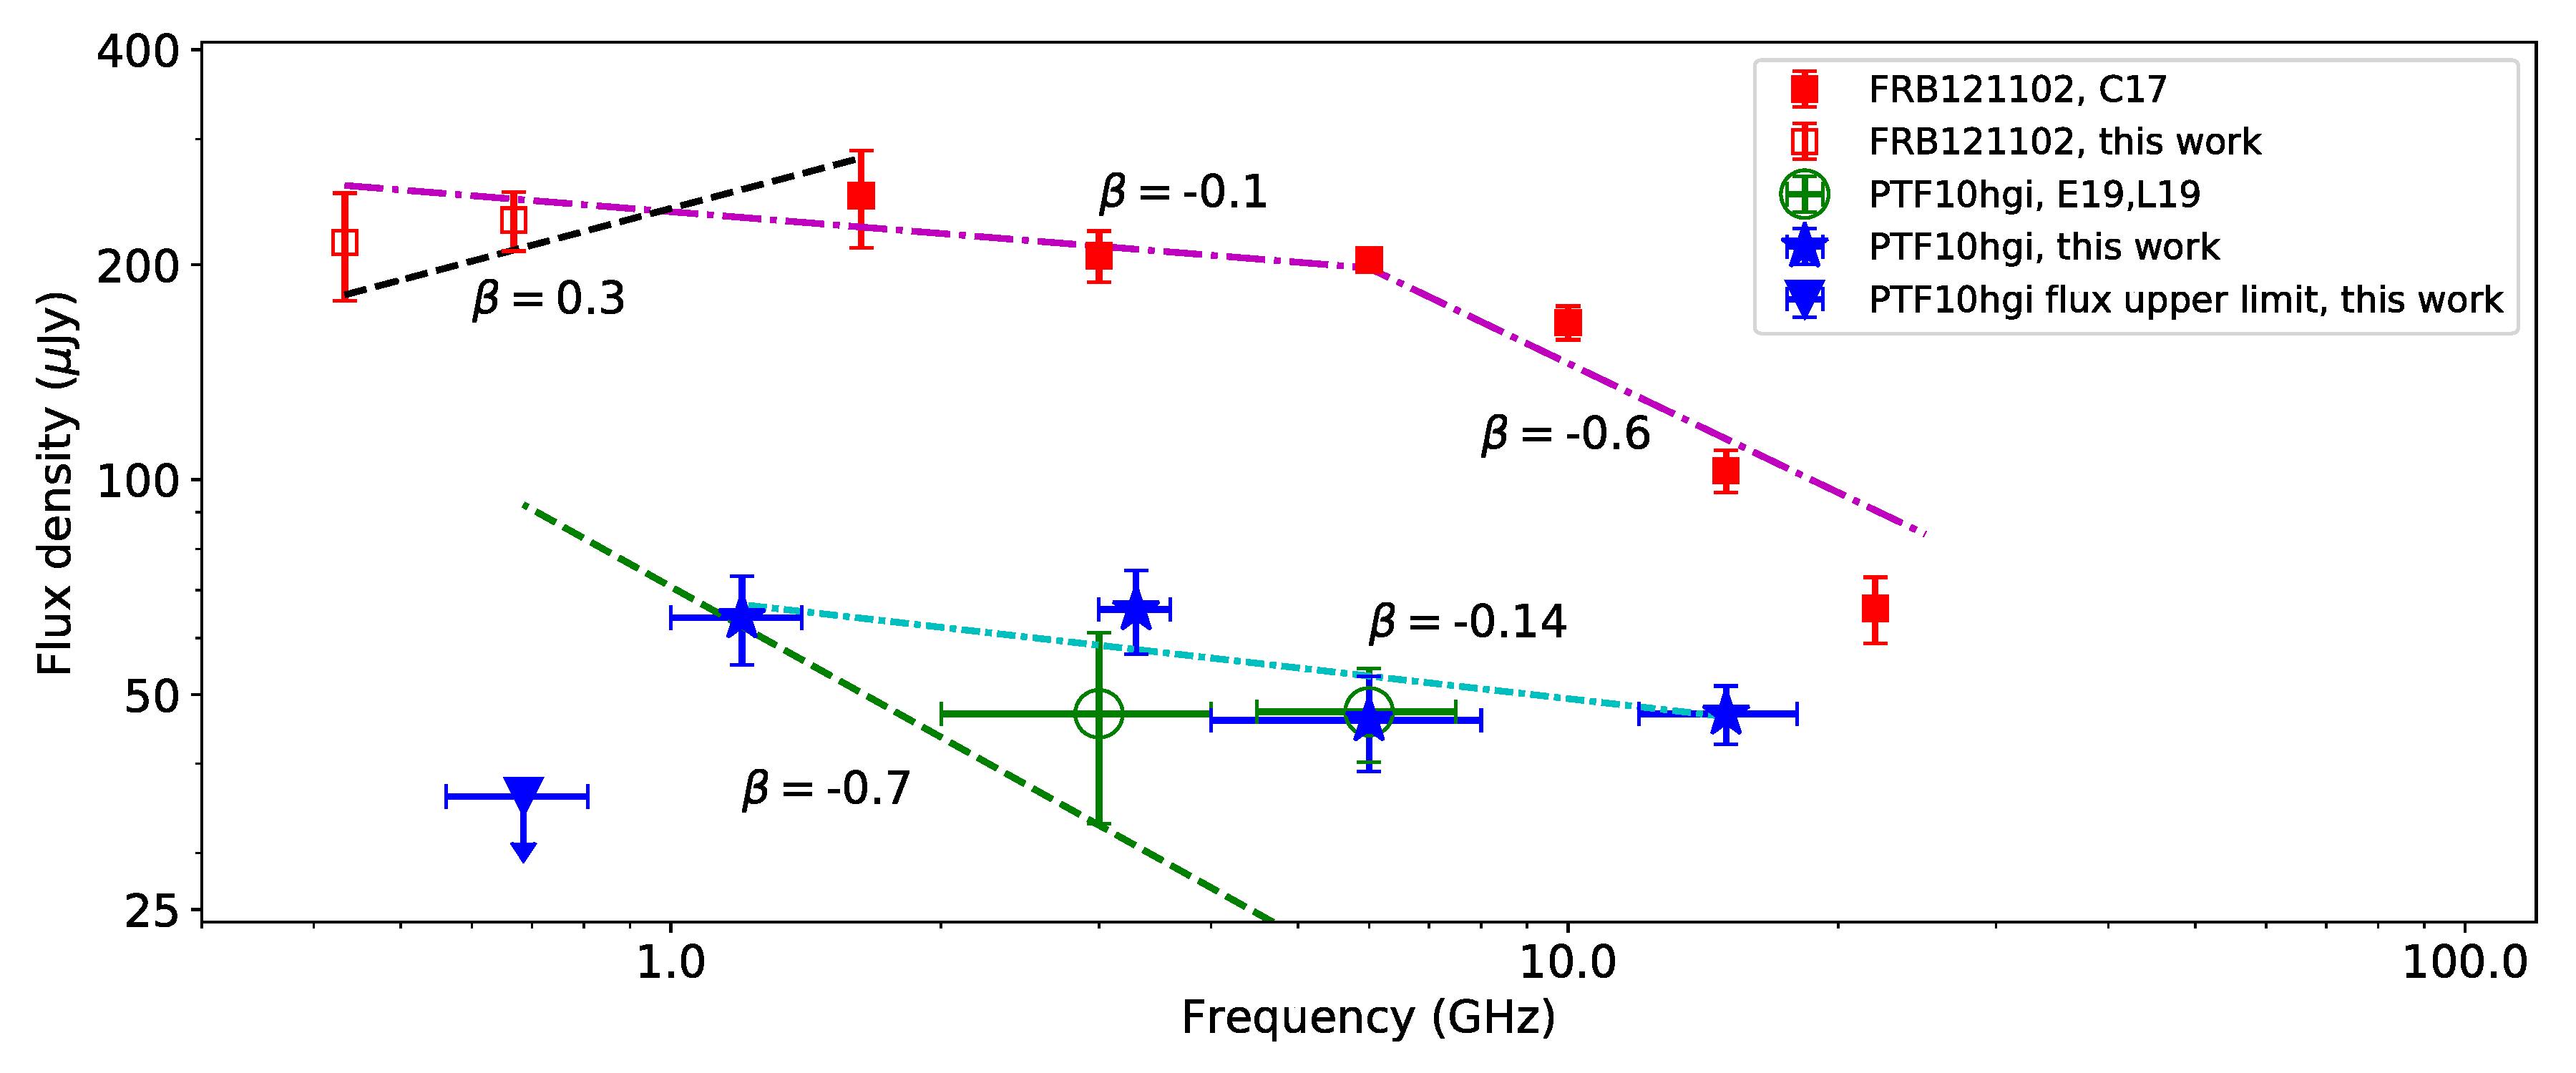
Superluminous supernovae (SLSNe) are a type of supernova that have an optical absolute magnitude <−21 and are more than 10 times brighter than typical supernovae. Of the SLSNe, the most mysterious ones are the Type I SLSNe, which do not show any hydrogen line in their optical spectra. Little observational evidence exists to test the various theories proposed to explain the high luminosity of these objects. Additionally, at least some of the Type I SLSNe are hypothesised to emit Fast Radio Bursts (FRBs). However, this association was made based on the properties of the host galaxy of a very well studied FRB, FRB121102 and the host galaxies of Type I SLSNe. Until the present work, there had been no quantitative study of the relationship between the radio emission from a Type I SLSN and that from an FRB. Mondal et al. observed the first radio-detected Type I SLSN, PTF10hgi, over a wide frequency range spanning 0.6-18 GHz using the upgraded Giant Metrewave Radio Telescope (uGMRT) and the Karl G. Jansky Very Large Array (JVLA), and quantitatively estimated the various physical properties of the radio-emitting region. The spectral nature of the source was found to be very similar to that of the persistent radio source associated with FRB121102. Their analysis revealed that the radio emission of PTF10hgi originates from a magnetar wind nebula, confirming the hypothesis of Inserra et al. (2013). They also demonstrated that the nebula is powered by the rotational energy of the magnetar. Additionally, Mondal and collaborators analysed archival uGMRT data and extended the available spectrum of FRB121102 to 0.3 GHz. These new measurements put strong constraints on some of the models of FRB121102, ruling out some models. Wang et al. (2020) have already demonstrated that the persistent emission of FRB121102 might be powered by the same mechanism that powers the radio emission of SLSNe, demonstrating for the first time a relationship between a Type I SLSN and a FRB. Based on their calculations, Mondal et al. (2020) also hypothesised that if PTF10hgi is emitting FRBs, their energies will be much lower than that observed from FRB121102. The spectra of the two sources are shown in the adjoining image, where beta is the power-law index of the radio spectrum.
A 3D Framework to Explore the Propagation Effects in Stars Exhibiting Electron Cyclotron Maser Emission
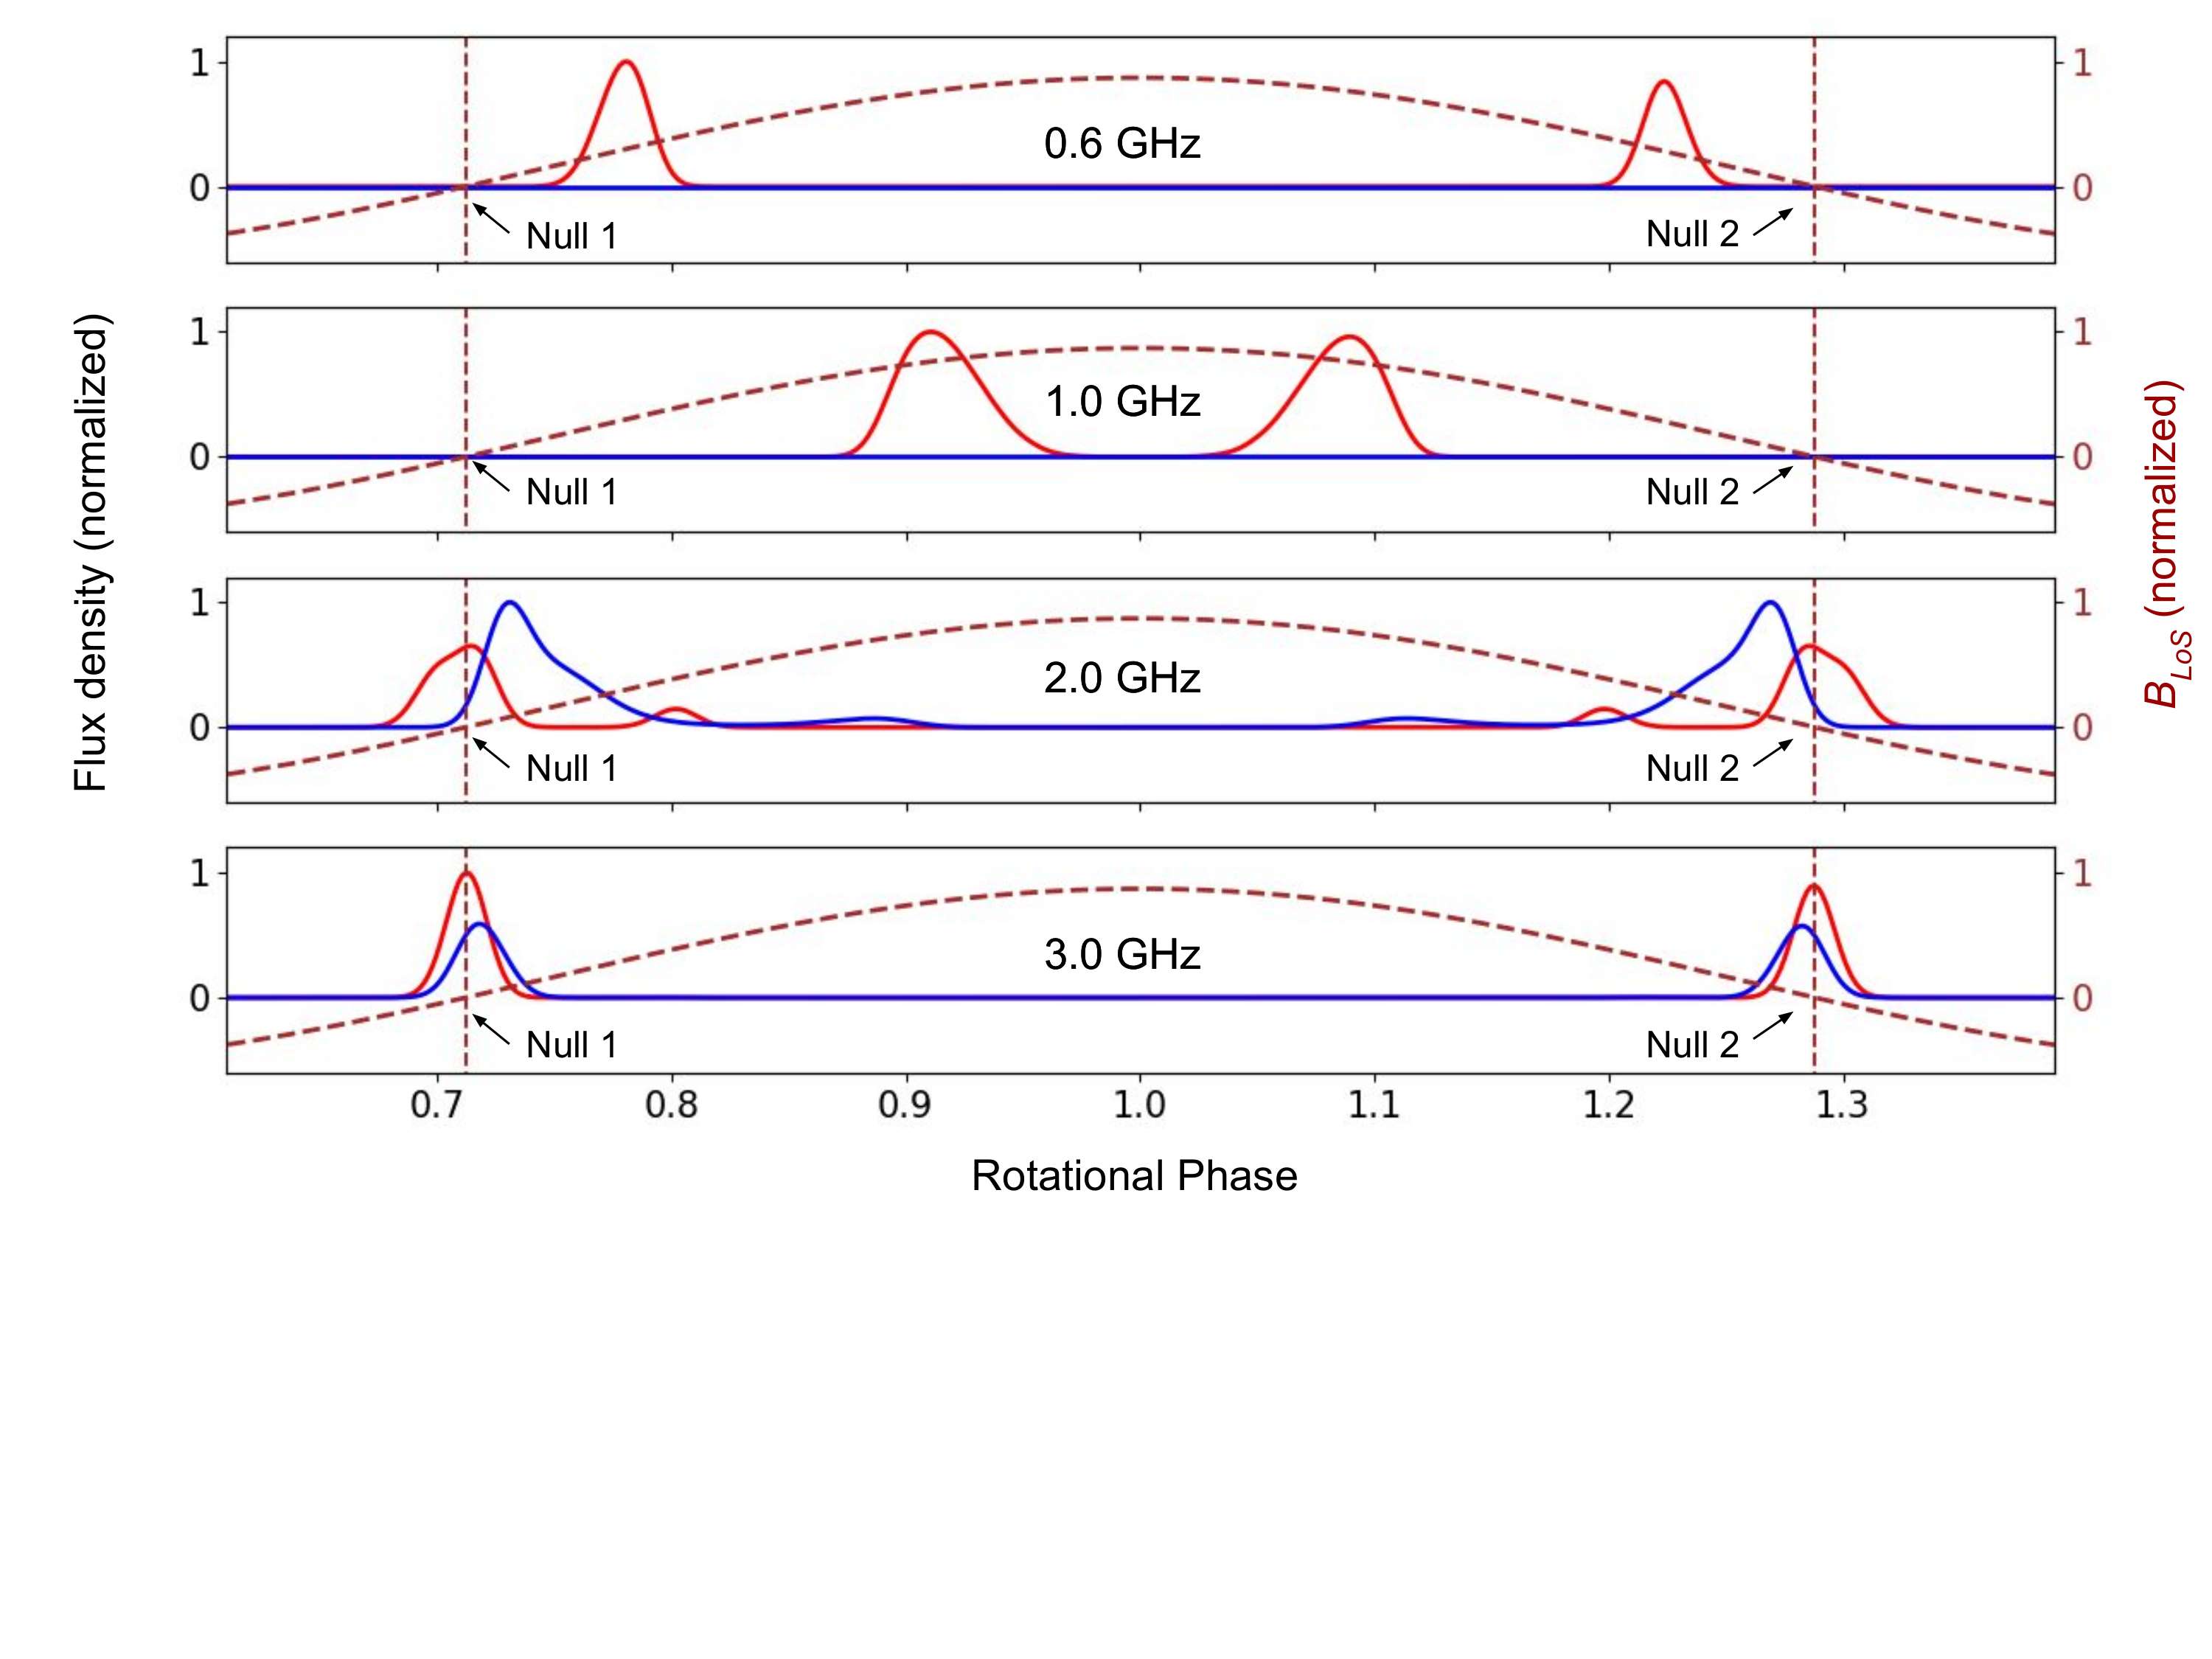
Hot magnetic stars are unique objects that harbour highly stable, kGauss-strength global magnetic fields. The interaction between their magnetic fields and the radiatively driven stellar wind leads to the formation of corotating magnetospheres around them. A number of these stars have recently been discovered to produce electron cyclotron maser emission (ECME). ECME is a type of coherent radio emission which is seen as periodic pulses giving the host star the name of ‘main-sequence pulsar’. This emission has several interesting properties like very high directivity and circular polarization, which can be exploited to probe the stellar magnetosphere. Das et al. (2020) developed a 3D framework to predict how the ECME light curve will vary for different plasma distributions in the stellar magnetosphere due to refraction. Note that this is the first and, currently, the only framework to quantitatively study the propagation effect experienced by ECME while passing through the dense magnetosphere of the hot magnetic star. Before that, it was thought that the effect of propagation is limited to introducing a frequency dependence of the rotational phases of arrival of the ECME pulses. In contrast, Das et al. found that for stars which have highly misaligned rotation and magnetic axes, the propagation effect can alter not only the rotational phases of arrival, but also the profile, relative height, and, in the extreme case, the visibility of the pulses as well. This information will be highly useful to constrain the plasma distribution in the stellar magnetosphere based on the observed shape of the ECME lightcurves. In the figure, simulated ECME lightcurves are shown for a case in which the host star has a highly azimuthally asymmetric plasma distribution in its magnetosphere.
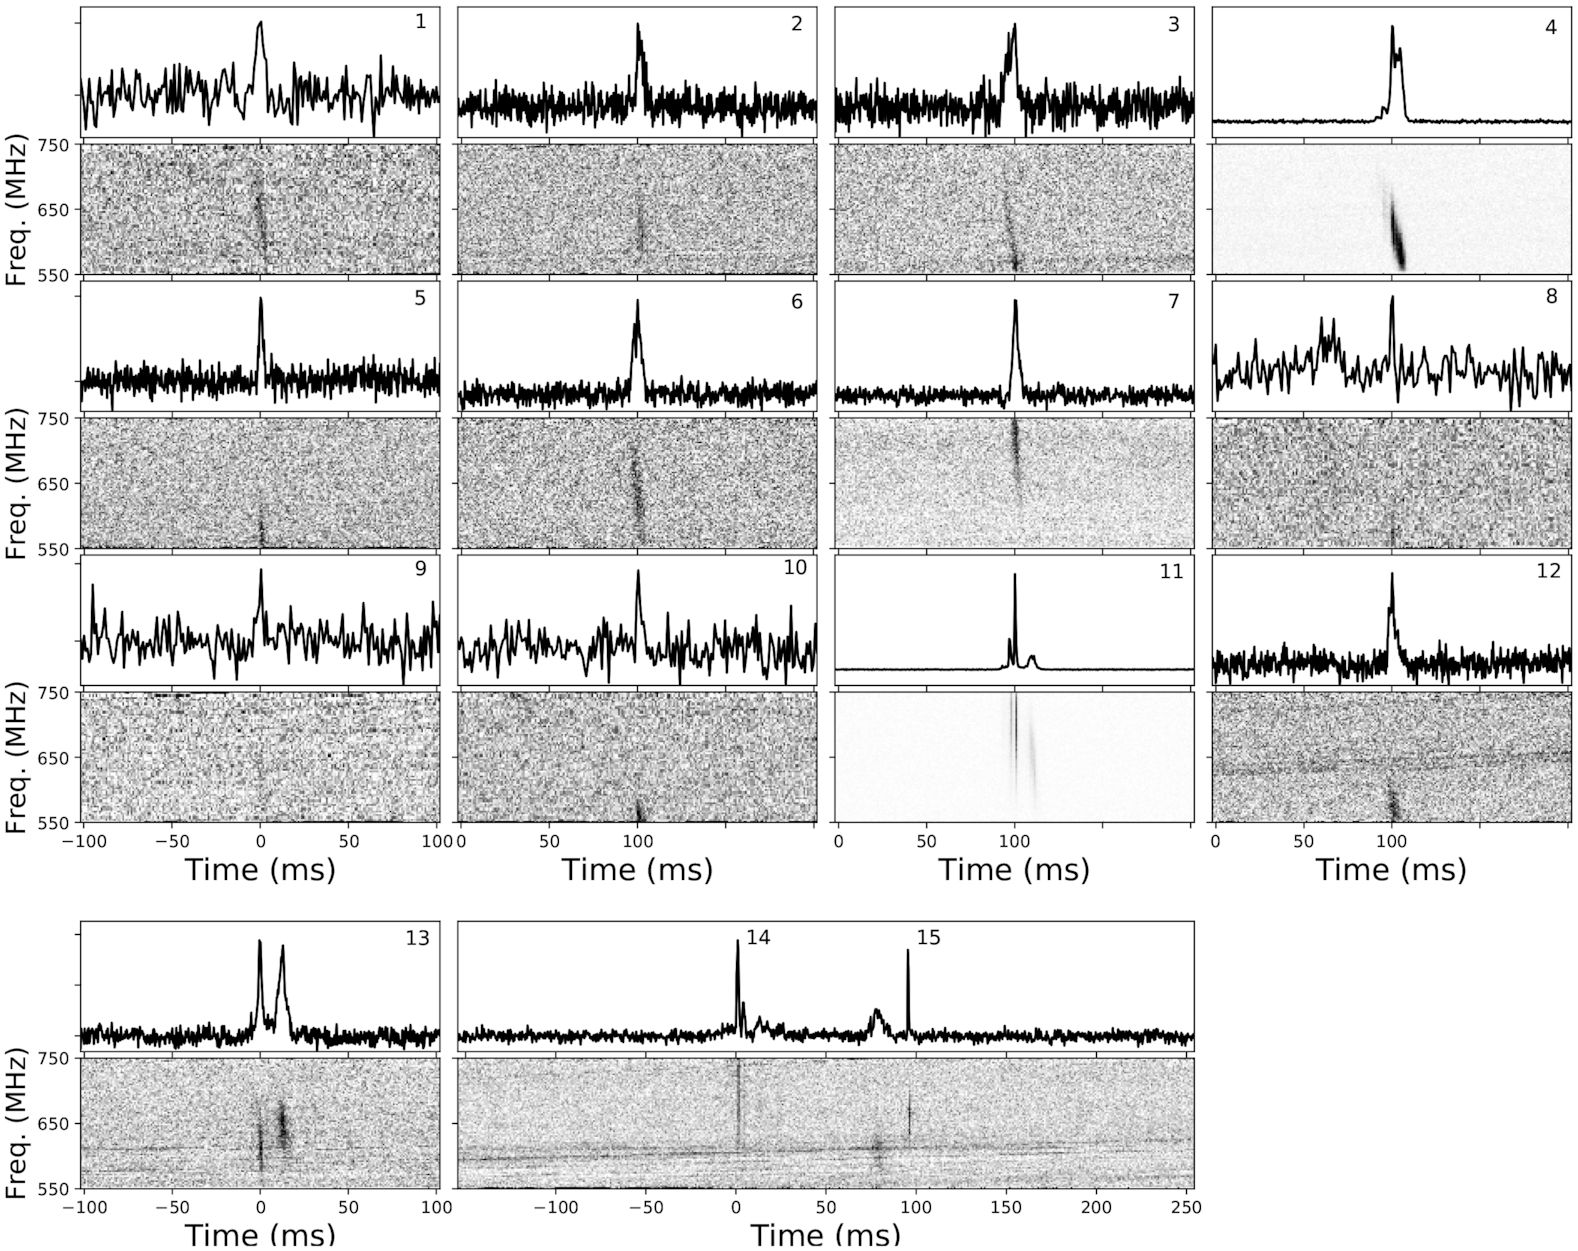
Detection of 15 bursts from FRB180916.J0158+65 with the upgraded GMRT
Marthi et al. report the GMRT detection of 15 bursts from the fast radio burst (FRB) FRB180916.J0158+65, better known as R3. They used the GMRT Band-4 receiver to observe R3 at 550-750 MHz, with three sessions, each of ~2 hour duration. Each session was scheduled around the peak of the active window of the 16.35-day period of R3. They detected 0, 12 and 3 bursts respectively, suggesting a highly variable burst rate. These 15 beamformer-detected bursts include the largest number detected in a single session (12) as well as the lowest fluence bursts (0.1 Jy ms) of R3 till date. The low fluence bursts have an important implication - they are only ~10-25 times more energetic than the bursts from the Galactic source SGR1935+2154, strengthening the case for a possible astrophysical connection between the brightest Galactic bursts and the faintest FRB events. The bursts show rich structure in time and frequency. Marthi et al. devise a technique based on singular value decomposition to determine the dispersion measure (DM) that maximizes energy in the temporal substructure, but find that the DMs so determined for the brightest bursts are consistent with the median value of 348.82 pc per cubic cm. Although R3 has been localized to a nearby spiral galaxy (at a distance of ~150 Mpc and a redshift of ~0.0337), they image the two brightest bursts using the interferometric visibilities, providing proof-of-concept for future GMRT experiments to localize unlocalized CHIME repeaters. They also report a candidate short timescale periodicity of 15.6 ms. Confirmation of a short timescale periodicity is evidence for a neutron star progenitor, whereas orbital motion or precession could explain the known 16.35-day periodicity. Further GMRT observations of R3 are underway to confirm or rule out the short timescale periodicity, as well as investigate the origin of the 16.35-day periodicity.
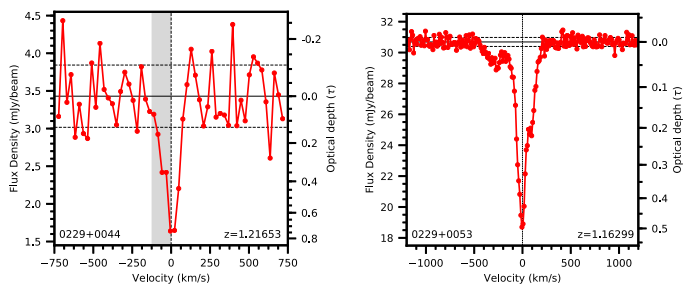
High-opacity associated HI 21cm absorbers at z~1.2
HI 21cm absorption arising from neutral hydrogen in the environments of Active Galactic Nuclei (AGNs) can be used to probe physical conditions in the AGN’s vicinity and how these conditions change over time. However, despite a large number of searches spanning many decades, only 7 such "recentResults"associated HI 21cm absorbers have been detected at redshifts greater than one. Chowdhury et al. used the new wide-band GMRT Band-4 receivers to discover two remarkable HI 21cm absorbers at a high redshift, z~1.2, against faint AGNs. The two absorbers were found in an unbiased search for HI 21cm absorption against all radio-continuum sources over a 1.2 square degree region of the sky, the first time that such a search has been carried out with a high sensitivity at high redshifts. The velocity-integrated HI 21cm optical depths of the two systems, shown in the figure, are greater than those of any known associated HI 21cm absorbers, and the two AGNs are very faint in both the radio and the ultraviolet wavebands. The discovery of these two systems is consistent with an earlier hypothesis that the dearth of associated HI 21cm absorbers at high redshifts, z>1, may be due to an observational bias wherein high-redshift AGNs targeted in surveys for associated HI 21cm absorbers are bright in the ultraviolet and radio wavelengths. The high AGN radio and/or ultraviolet luminosity may ionize or excite the HI in its vicinity, reducing the strength of the HI 21cm absorption. The two new HI 21cm absorbers emphasize the need to carry out unbiased HI 21cm absorption surveys and to extend future searches to low luminosity AGNs.
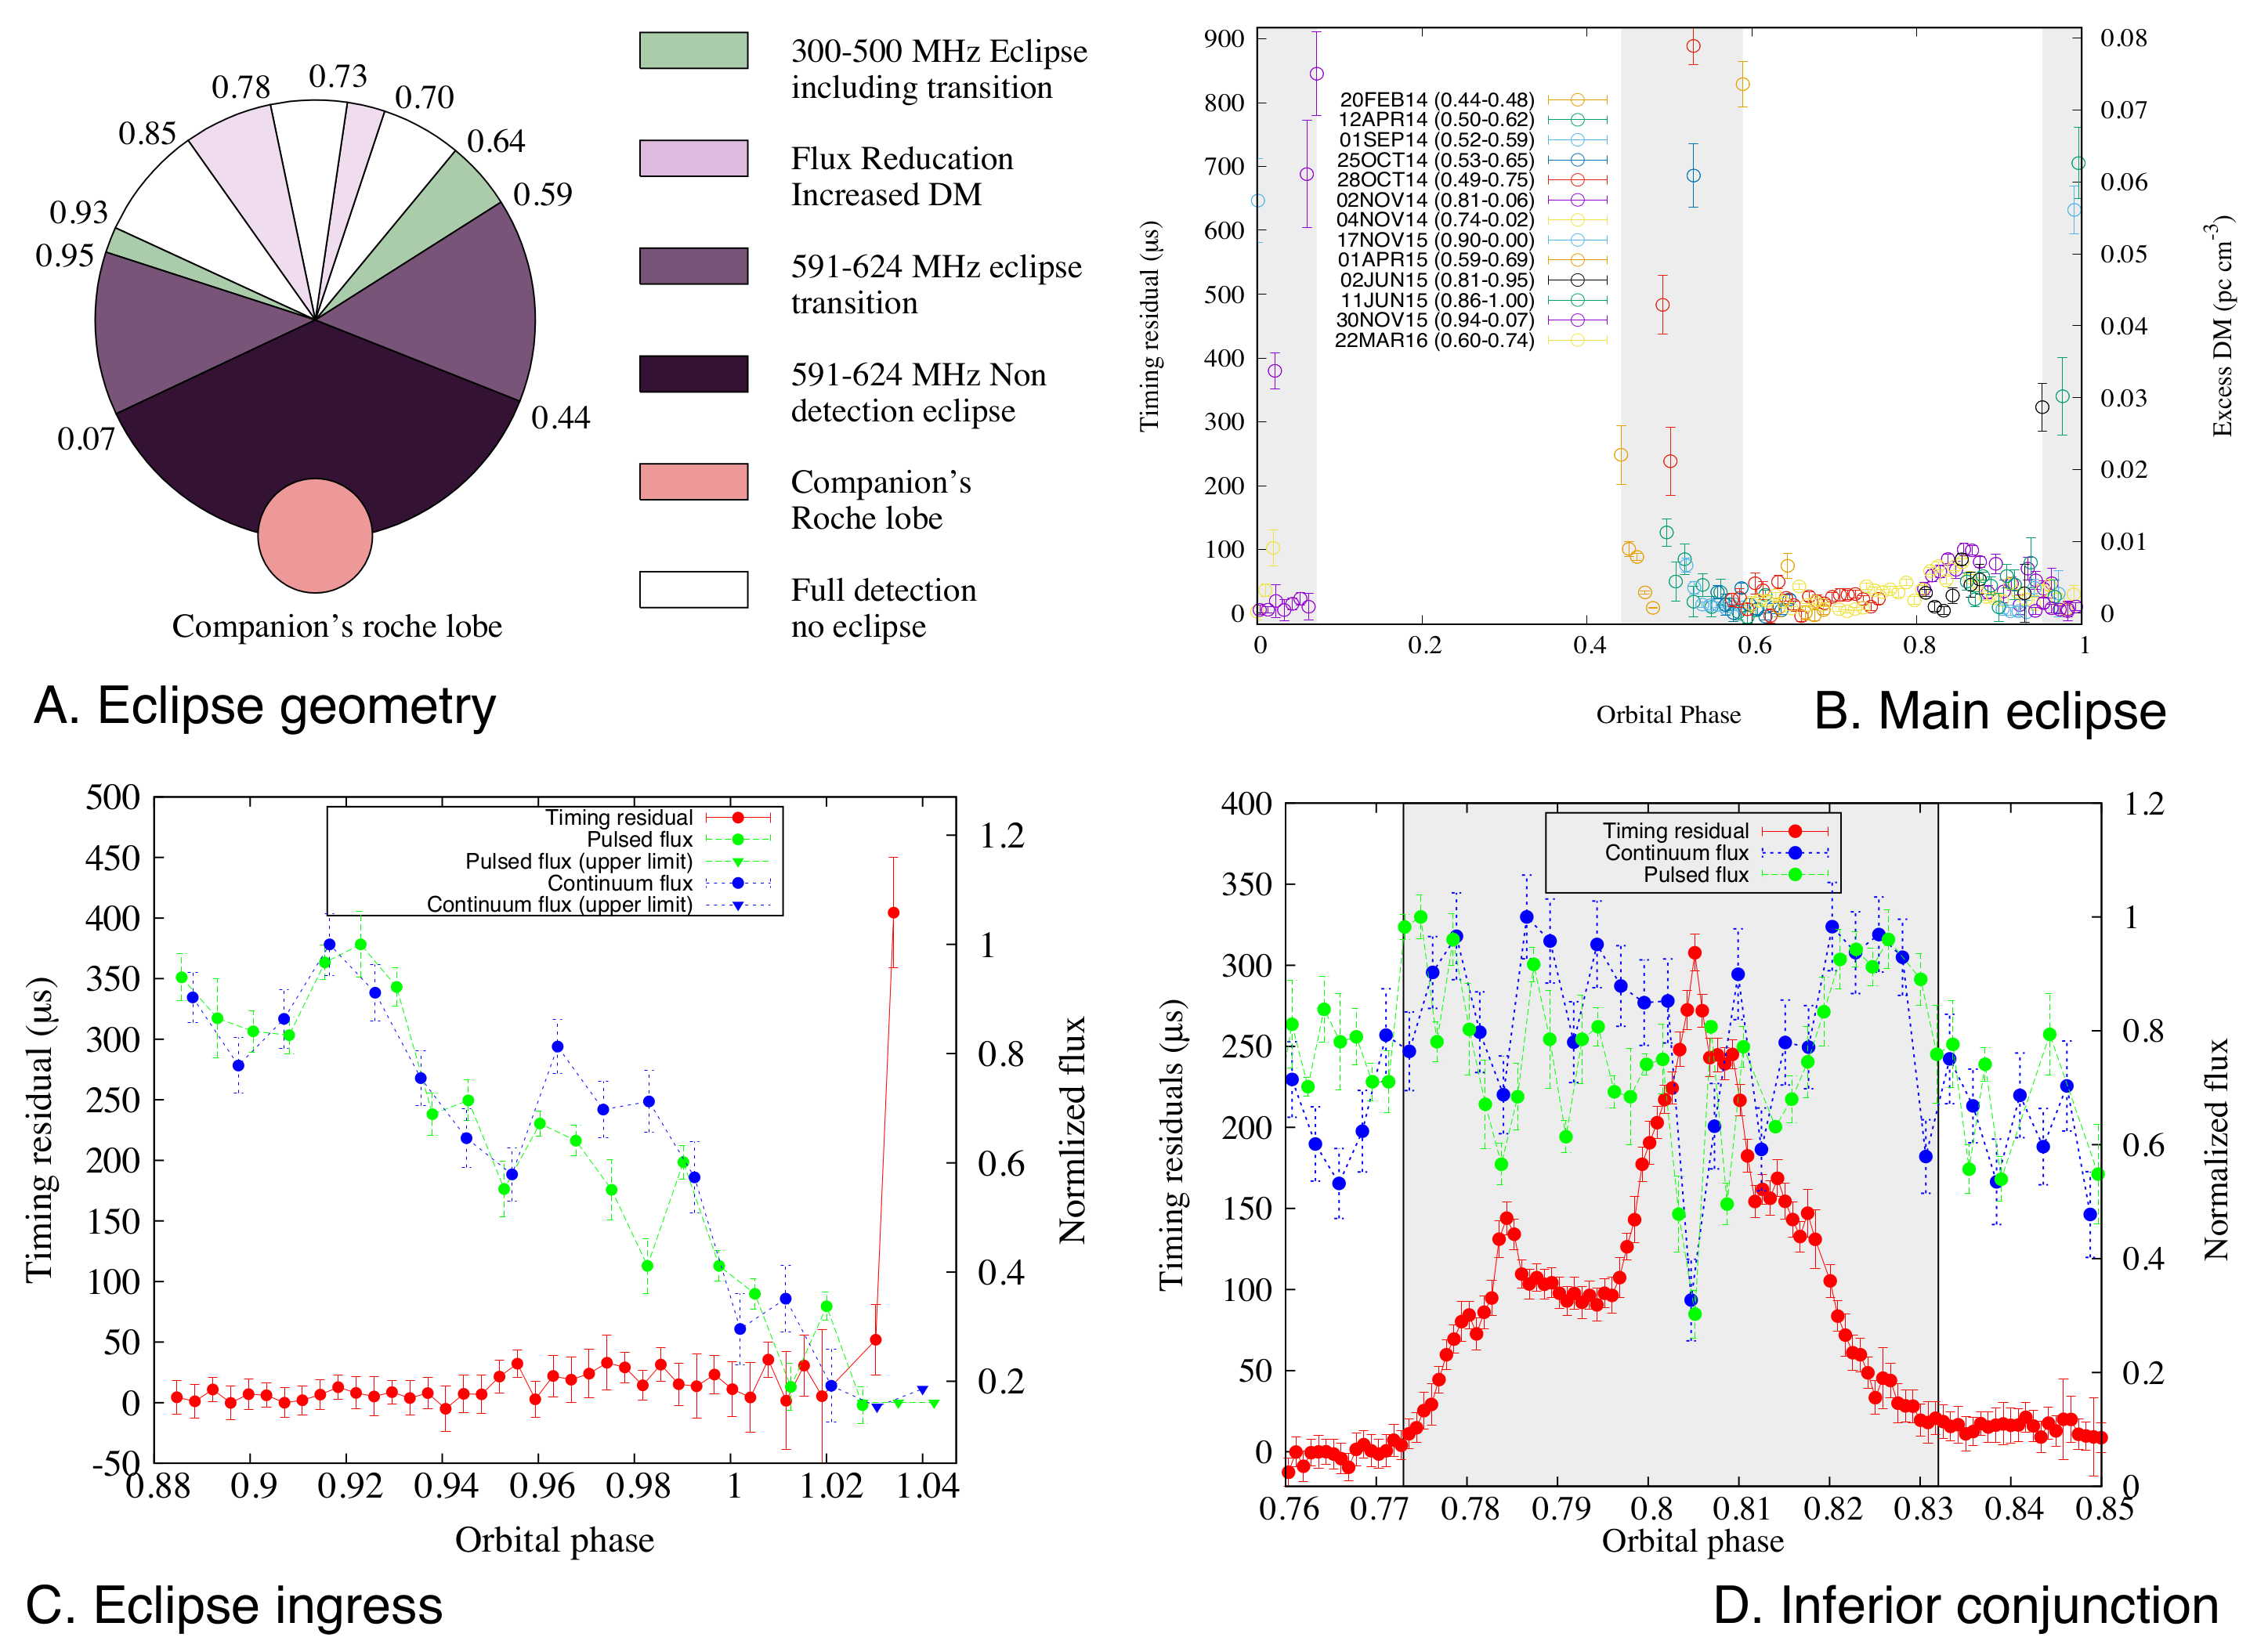
A study of eclipses for the redback pulsar J1227-4853
Kudale et al. present a multifrequency study of eclipse properties of a transitional redback millisecond pulsar J1227-4853 discovered with the GMRT. Emission from this pulsar is eclipsed at 607 MHz for about 37% of its orbit (shown in panel-B) around the superior conjunction. The authors observed eclipse ingress and egress transitions (identified by excess dispersive delays up to 0.079(3) pc cm^-3) that last for 12% and 15% of the pulsar orbit, respectively, resulting in only 36% of the orbit being unaffected by eclipsing material. Simultaneous dual-frequency GMRT observations (300-500 MHz and 550-750 MHz) allowed a probe of the frequency-dependent eclipse geometry (shown in panel-A) with a power-law index for the frequency dependent eclipse duration as n = -0.44. The simultaneous timing and imaging studies (shown in panel C & D) suggest that the eclipses in J1227-4853 are not caused by temporal smearing due to excess dispersion and scattering, but could be caused by removal of pulsar flux due to cyclotron absorption of the pulsed signal by intra-binary material; this can be used to constrain the magnetic field of the companion. In order to check if cyclotron-synchrotron absorption of pulsar emission by nonrelativistic or relativistic electrons is the cause of the eclipse, the authors estimated the magnetic field of the eclipsing plasma in the vicinity of the companion to be 27 G, and the cyclotron fundamental frequency to be 77 MHz. Observed eclipses reported in the paper for PSR J1227-4853 are centered at 322 and 607 MHz, which are the fourth and eighth harmonics of the above cyclotron fundamental frequency. For PSR J1227-4853, cyclotron absorption at the fundamental cyclotron frequency and its lower harmonics could be the cause of eclipse. Additionally, near the inferior conjunction at orbital phases 0.71 and 0.82 the pulsed emission is significantly delayed (corresponding to a DM change of 0.035(3) pc cm^-3), which is associated with a fading of the pulsed and continuum flux densities (shown in panel-A, by light purple color). The minima in continuum flux densities (up to ~30% of the peak flux density) around the inferior conjunction coincide with the maxima in excess dispersion (shown in panel-D). Such flux fading around a fixed orbital phase near the inferior conjunction is not reported for other eclipsing binaries. This event around the inferior conjunction could be caused by absorption of the pulsed signal by fragmented blobs of plasma generated from mass loss through the L2 Lagrangian point.
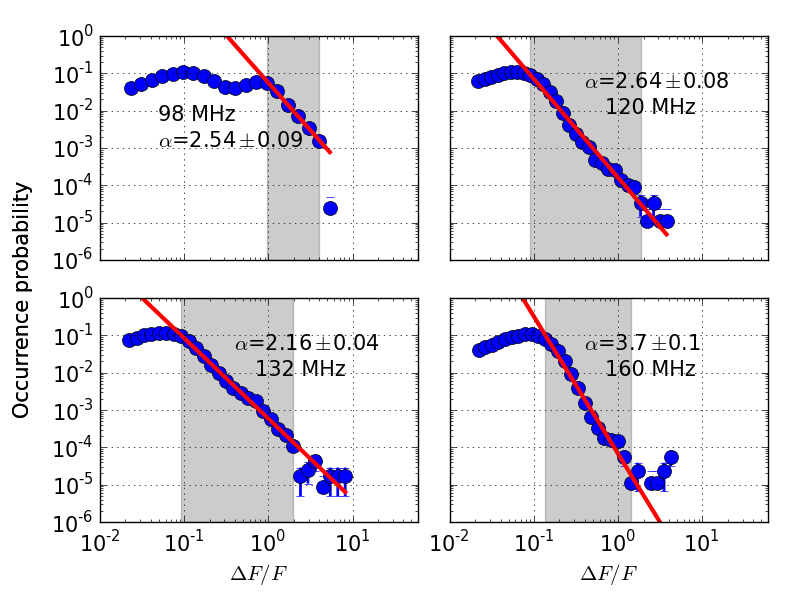
First radio evidence for impulsive heating contribution to the quiet solar corona
Explaining the presence of the million Kelvin corona sitting atop a 5800 Kelvin photosphere has been one of the longest-standing mysteries of solar physics. One of the hypotheses put forth for explaining this is the so called “nanoflareâ€-based coronal heating hypothesis (Parker, 1988). According to it, a large number magnetic reconnections keep taking place all of the over the Sun all the time; individually these small explosions involve only about a billionth of the energy of a large solar flare, but collectively they extract sufficient energy from the coronal magnetic fields to be able to heat and maintain the corona at a temperature of a million Kelvin. Considerable effort has been expended to look for observational evidence for the presence of these nanoflares in the X-ray and extreme ultraviolet bands, and has led to the conclusion that the observed distribution of even the weakest of the flares detected thus far is not consistent with the requirements for coronal heating. For the first time, Mondal et al. (2020) provide firm observational evidence for the presence of impulsive nonthermal radio emissions from the quiet solar corona, which form the smoking guns for the weak underlying magnetic reconnection processes. They meet all of the known criteria for coronal heating – they are found all through the quiet sun regions; and their radio flux density distribution has a power-law tail with a slope steeper than -2 at all frequencies (see figure). Mondal et al. estimate the energy that must be dumped in the corona to generate these impulsive emissions: this is consistent with the coronal heating requirements. These impulsive emissions have durations <1 second, their fractional time occupancy at a given region is <10%, and they show signs of clustering at small timescales. Additionally, the statistical properties of these impulsive emissions are very similar to those recently determined for magnetic switchbacks by the Parker Solar Probe. This study used data from the Murchison Widefield Array and was made possible by reliable detection of impulsive non-thermal solar emissions down to flux densities of a thousandth of a an SFU (1 SFU = 10,000 Jy), about two orders of magnitude fainter than earlier studies.
ALMA [CII] 158um imaging of an HI-Selected Major Merger at z~4
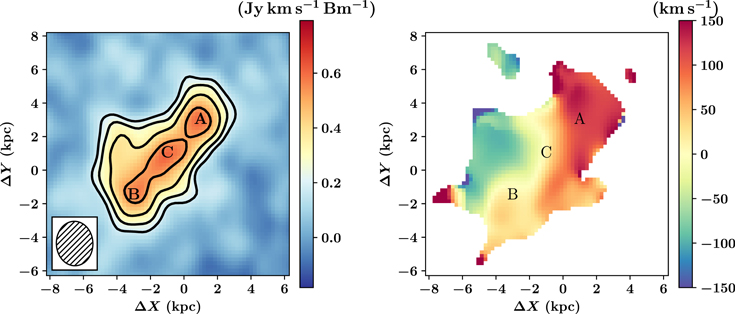
Prochaska et al. used the Atacama Large Millimeter/submillimeter Array (ALMA) to obtain high spatial resolution (~ 2 kpc) observations of [CII] 158-micron and dust-continuum emission from a galaxy at z=3.7978 selected by its strong Lyman-alpha absorption (a damped Ly-alpha absorber, DLA) against a background QSO. Their ALMA images reveal a pair of star-forming galaxies separated by approximately 6 kpc (projected) undergoing a major merger. Between these galaxies is a third emission component with highly elevated [CII] 158-micron A emission relative to the dust continuum (by a factor of ~2), which is likely to arise from stripped gas associated with the merger. This merger of two otherwise-normal galaxies is not accompanied by enhanced star-formation, contrary to mergers detected in most luminosity-selected samples. The DLA associated with the merger exhibits extreme kinematics, with a velocity width for the low-ionization metal lines of roughly 470 km/s, that spans the velocity spread revealed in the [CII] 158-micron emission. The authors propose that DLAs with high low-ionization metal line widths are a signpost of major mergers in normal galaxies at high redshifts, and use the distribution of the velocity widths of metal lines in high-z DLAs to provide a rough estimate of the fraction of z>3 galaxies that are undergoing a major merger. Figure: (Left) The zeroth-moment image showing the integrated [CII] 158-micron flux density of the galaxies A and B associated with the absorption-selected galaxy. The axes are labeled in physical units (kpc) at z=3.7978. The lowest contour corresponds to 3-sigma significance, with the contours increasing by a factor of sqrt(2). (right) The first-moment image showing the flux density-weighted velocity field, restricted to regions where the integrated flux density exceeds 2.5-sigma significance. There are two kinematically distinct components which we associate with a pair of merging galaxies, labeled A and B. There is additional emission between these components, referred to as component C, which appears to be gas stripped during the merger.
A cold, massive, rotating disk galaxy 1.5 billion years after the Big Bang
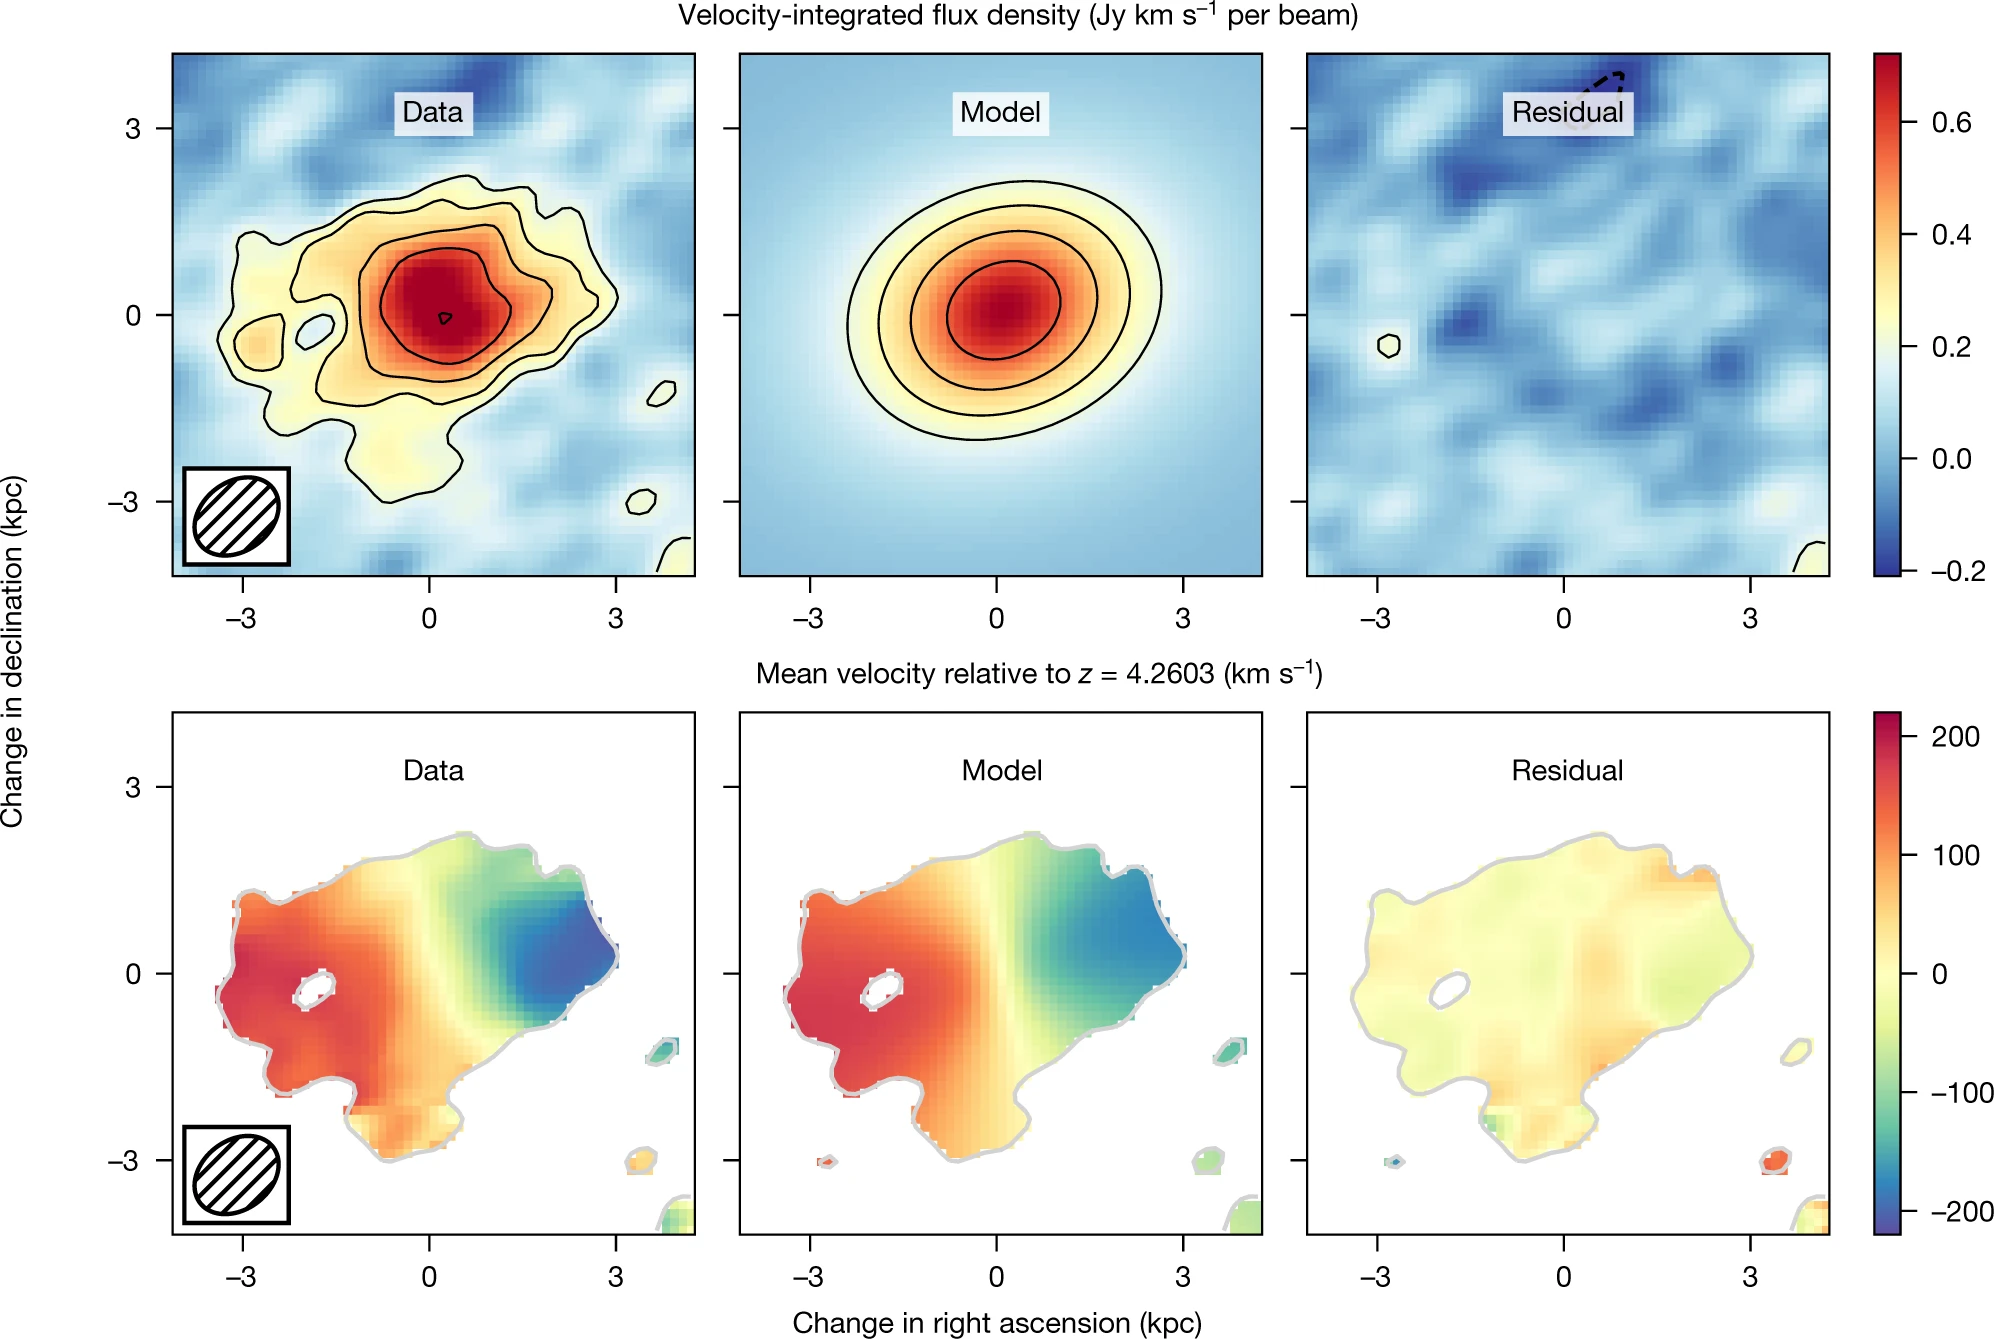
Massive disk galaxies like the Milky Way are expected to form at late times in traditional models of galaxy formation, but recent numerical simulations suggest that such galaxies could form as early as a billion years after the Big Bang through the accretion of cold material and mergers. Observationally, it has been difficult to identify disk galaxies in emission at high redshift in order to discern between competing models of galaxy formation. Neeleman et al. report Atacama Large Millimeter/submillimeter Array (ALMA) imaging, with a resolution of about 1.3 kiloparsecs, of the 158-micrometre emission line from singly ionized carbon ([CII]), the far-infrared dust continuum and the near-ultraviolet continuum emission from a galaxy at a redshift of 4.2603, identified by detecting its absorption of quasar light. The ALMA observations show that the emission arises from gas inside a cold, dusty, rotating disk with a rotational velocity of about 272 kilometres per second. The detection of emission from carbon monoxide in the galaxy yields a molecular mass that is consistent with the estimate from the ionized carbon emission of about 72 billion solar masses. The existence of such a massive, rotationally supported, cold disk galaxy when the Universe was only 1.5 billion years old favours formation through either cold-mode accretion or mergers, although its large rotational velocity and large content of cold gas remain challenging to reproduce with most numerical simulations. Figure: The top row shows the velocity-integrated [CII] flux density for the data (left panel), the constant rotational velocity model (middle panel) and the residual after subtracting the model from the data (right panel). The outer contour is at 3 sigma, where sigma is the standard deviation of the noise in the observations, with contours increasing in powers of sqrt(2). No negative contours at the same levels are observed in the image. The synthesized beam of the observations is shown in the bottom left corner of the leftmost plot. The bottom row shows the mean velocity of the [CII] emission, for the data (left panel), the model (middle) and the residuals (right). Velocities are relative to the systemic velocity of the [CII] emission, corresponding to z = 4.2603.
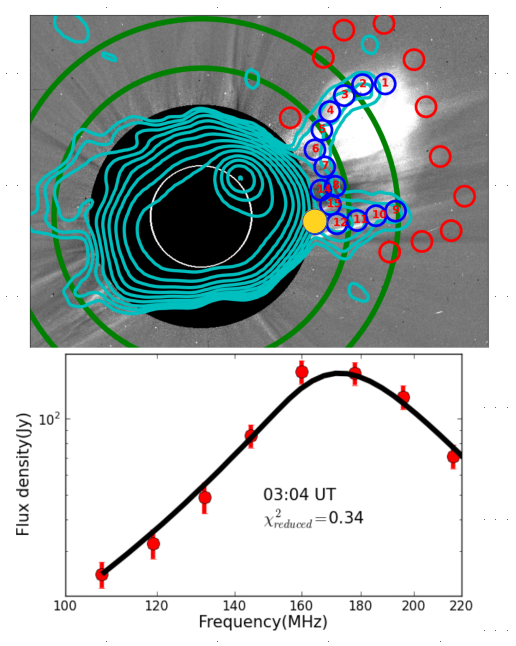
Estimation of the physical parameters of a CME at high coronal heights using low frequency radio observations
Measuring the physical parameters of Coronal Mass Ejections (CMEs), and particularly their entrained magnetic field, is crucial for understanding their physics and assessing their geo-effectiveness. At present, only remote sensing techniques can probe these quantities in the corona, the region where CMEs originate and acquire their defining characteristics. Radio observations offer a direct means for estimating the CME magnetic field by measuring the gyrosynchontron emission from CME plasma. Though simple in concept, this has proven to be challenging in practice, and there exist only a handful of successful examples in the literature. In this work, Mondal et al. measure various CME plasma parameters, including the magnetic field, by modeling the gyrosynchrotron emission from a CME. The radio imaging was done using the Murchison Widefield Array (MWA), and the high imaging dynamic range of these images allowed Mondal et al. to reliably detect these faint emissions. In fact, they were able to detect radio emission from a CME out to a larger distance (approximately 4.7 solar radii) than has been reported till date. The radio flux densities reported here are among the lowest measured in similar works. The MWA observations also provide much denser spectral sampling than has been available earlier, giving Mondal et al. the ability to more accurately constrain the model parameters. The present study is based on extensive flux density measurements of a slow, and otherwise unremarkable, CME. This suggests that new telescopes like the MWA should now be able to routinely detect the radio counterparts of CMEs and estimate their magnetic fields. The upper panel of the figure shows the average normalised radio contours (over the frequency range 108-145 MHz) superposed on a LASCO/C2 difference image. The green circles mark 3 and 4 solar radii. The contour levels start at 0.02% of the peak and increase in factors of two. The bottom panel shows the measured flux density from the region marked in yellow in the upper panel, along with the best-fit gyrosynchrotron spectral model.