Science Highlights
Solar observations with MeerKAT
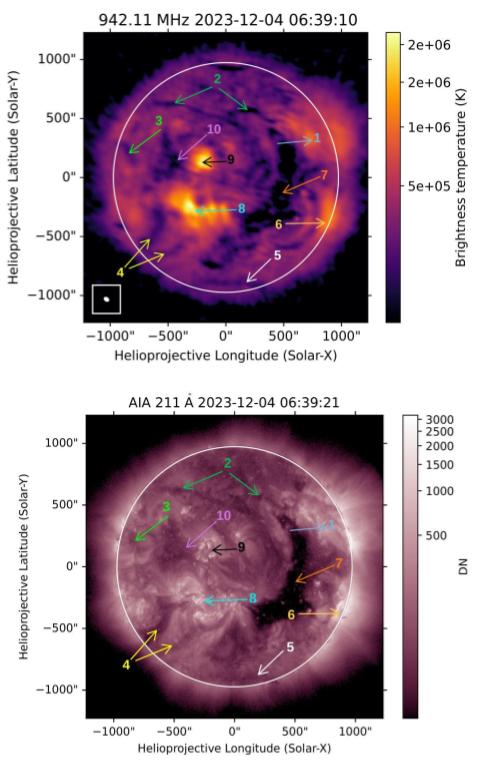
Solar radio emission offers powerful diagnostics of the solar corona, yet its highly dynamic, multiscale emission and extreme intensity contrasts pose substantial technical challenges. At gigahertz frequencies, MeerKAT provides a uniquely capable platform for high-fidelity, spectroscopic snapshot imaging of the Sun, enabled by its dense core, exceptional sensitivity, and broad instantaneous frequency coverage. As MeerKAT was originally optimized for faint galactic and extragalactic targets, observations with the Sun in the primary beam require specialized observing strategies and calibration approaches. Here, we demonstrate the technical readiness of MeerKAT for solar observations primarily in the UHF (580–1015 MHz) and L-band (900–1670 MHz) frequency ranges. This is achieved through optimized observing modes, a dedicated solar calibration framework, and a fully automated end-to-end calibration and imaging pipeline. The fidelity of the resulting solar radio image (top panel of the adjacent figure) is validated through detailed morphological comparisons with contemporaneous extreme-ultraviolet observations (bottom panel), in which corresponding coronal structures are indicated by numbered arrows. Early science results illustrate the diagnostic power of this new capability, including spectro-temporal imaging of coronal plasma potentially originating in the transition region, the identification of coronal hole–associated emission, and the tracking of the evolution of an erupting coronal mass ejection. Together, these results demonstrate that MeerKAT can probe coronal structure and dynamics across a wide range of spatial, spectral, and temporal scales. This development significantly expands MeerKAT’s scientific portfolio and establishes a robust foundation for solar observations with SKA-Mid, for which MeerKAT serves as the precursor.
Globular Clusters GMRT Pulsar Search (GCGPS). II. Discovery of Five Millisecond Pulsars in M69 and M70
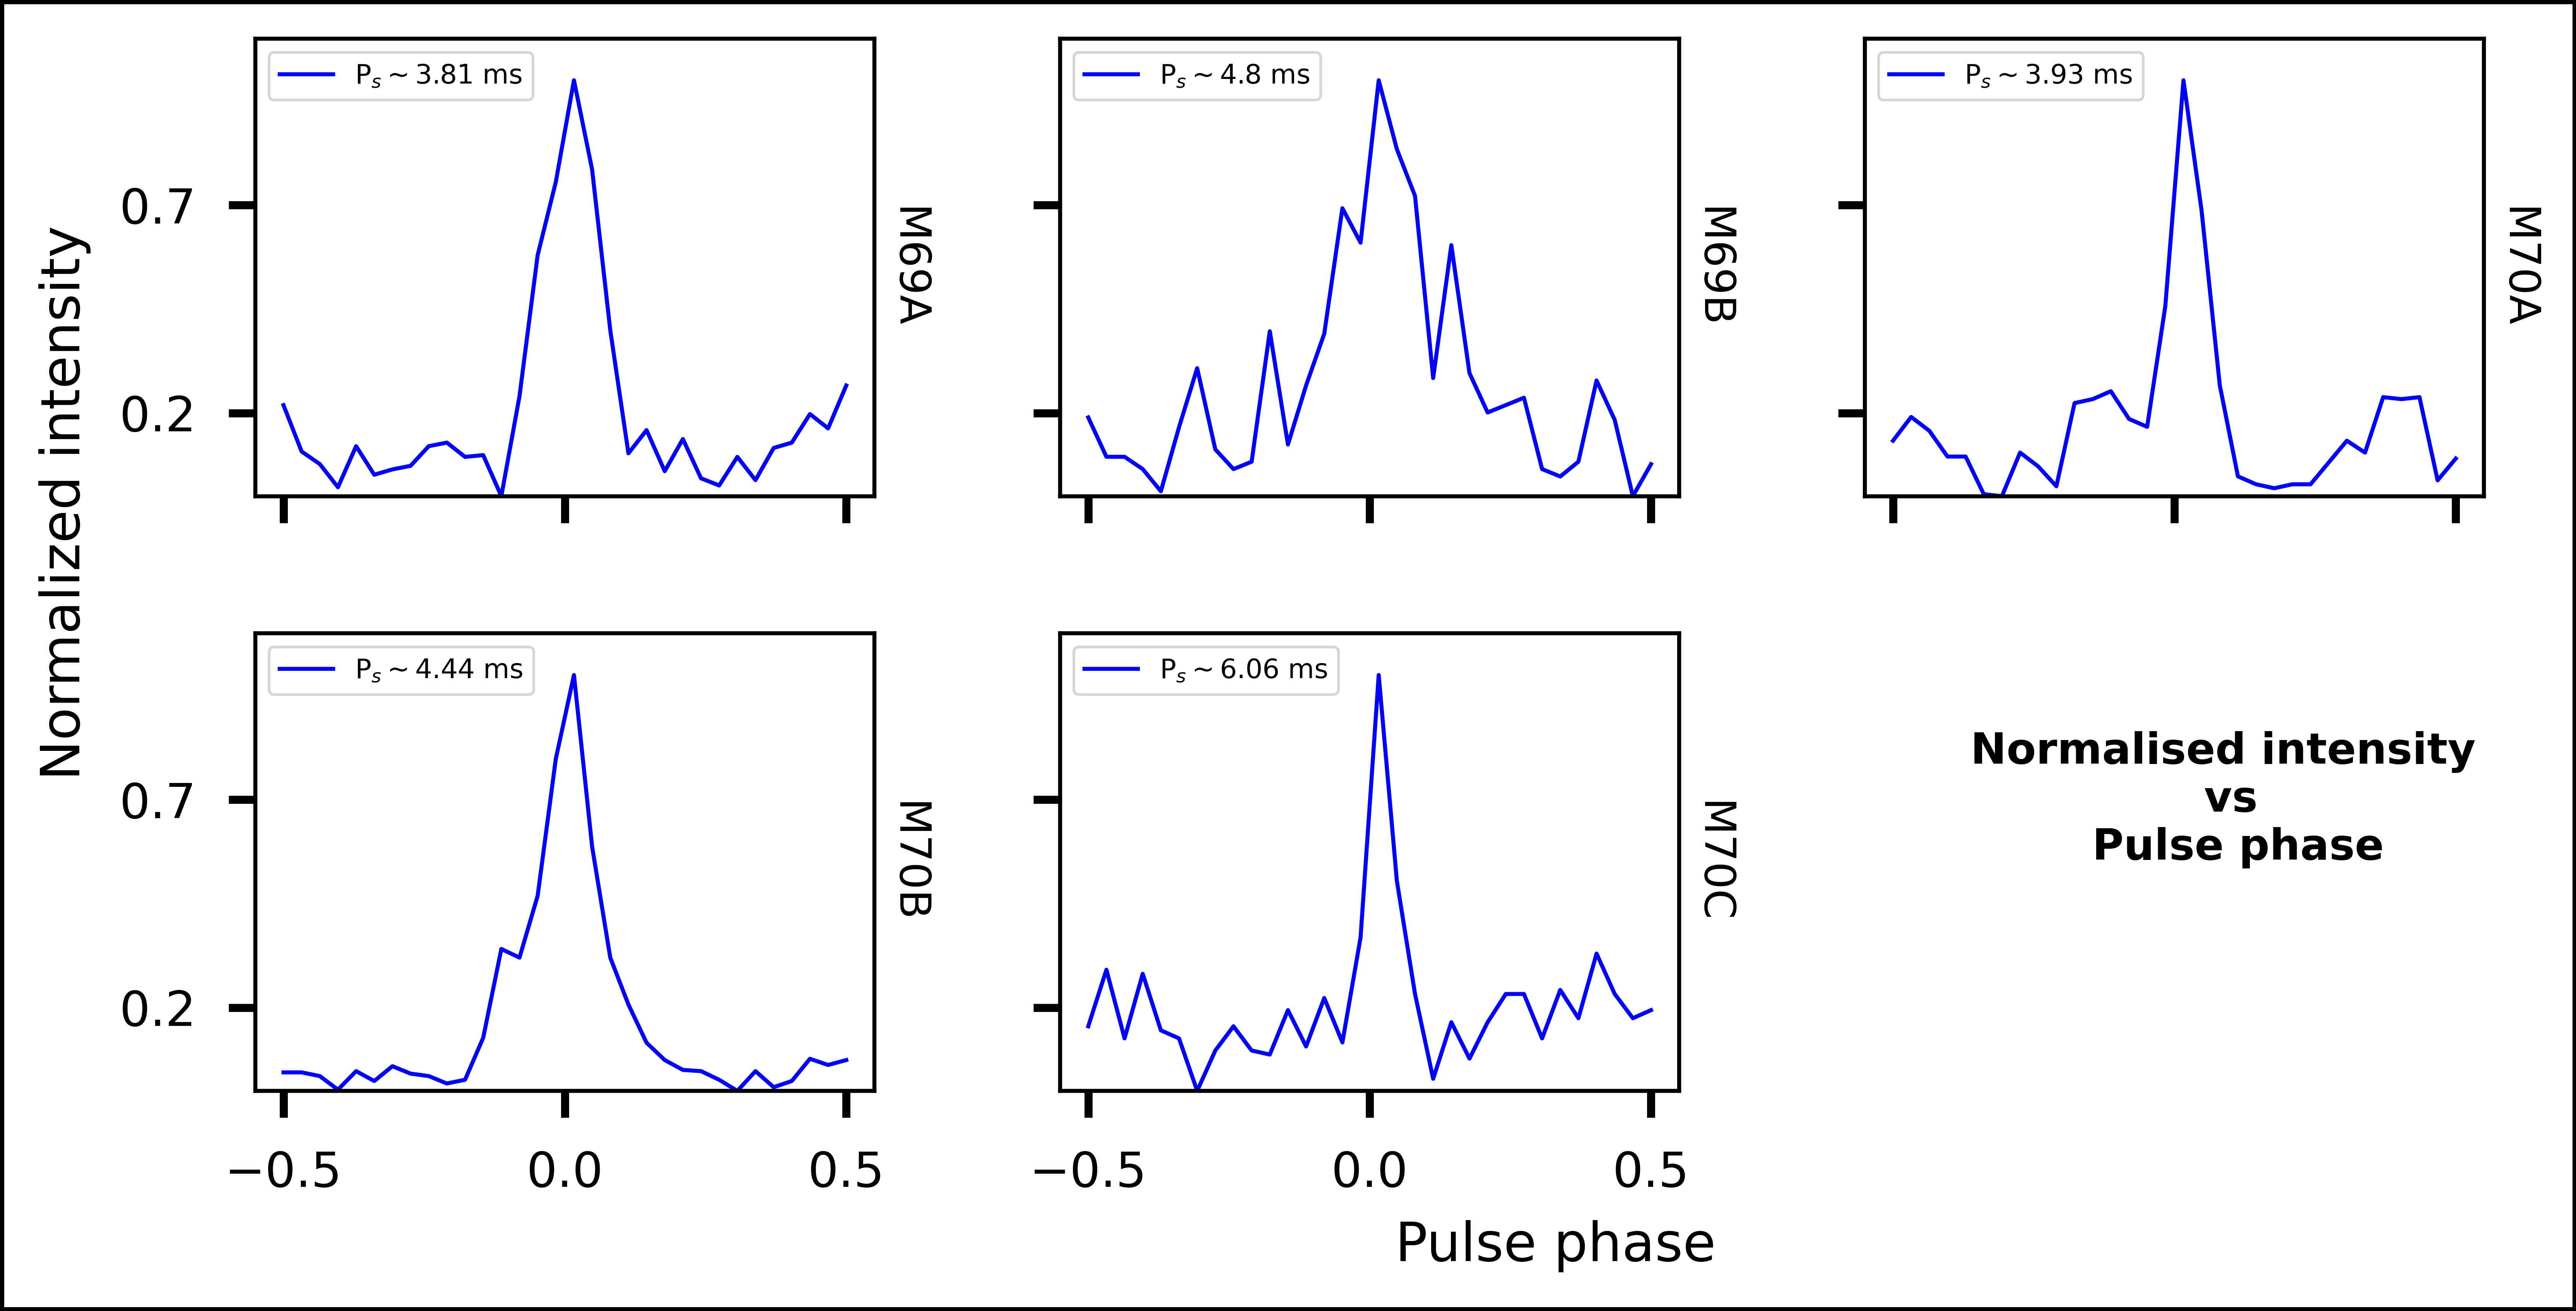
Globular clusters are among the oldest and most compact stellar systems in the Galaxy, where high stellar densities drive frequent dynamical interactions that efficiently form exotic compact binaries, including millisecond pulsars (MSPs). In this work, Das et al. report the discovery of five new MSPs from the Globular Clusters GMRT Pulsar Search (GCGPS) survey in two globular clusters, M69 and M70, both of which previously had no known pulsars. The attached figure shows the pulse profiles for the five new MSPs, with the names indicated to the right of each panel. The two MSPs in M69 have spin periods of 3.81 ms and 4.80 ms, with one showing clear orbital acceleration, indicating a compact binary system, while the other is likely isolated or in a wide binary. In M70, the three new MSPs have spin periods ranging from 3.93 to 6.06 ms, all consistent with typical recycled pulsars found in dense cluster environments. The discoveries were enabled by combining phased-array beamforming with interferometric imaging with the GMRT, allowing both high-sensitivity searches and positional constraints. The authors were able to localize PSR J1830-3220A (M69A) with arcsecond precision using the imaging and targeted beamforming technique, and also obtained positional constraints on the other four MSPs using imaging and beam simulation data; these can now be accurately localised via dedicated timing observations. The imaging analysis also reveals several faint, compact radio sources within the cluster fields that may represent additional, yet-undetected MSPs. The results demonstrate the strong capability of the GMRT and the GCGPS survey in probing globular clusters and expanding the known MSP population. The work also highlights the strong potential offered by the significant improvements in sensitivity and sky coverage in Phase II of the GCGPS survey, enabled by the SPOTLIGHT multibeam targeted mode with 160/320 beams. In Phase II, GCGPS is expected to uncover many more such systems and provide deeper insights into pulsar formation and cluster dynamics.
An automated, self-calibration-based pipeline for high-fidelity solar imaging with LOFAR: SIMPL
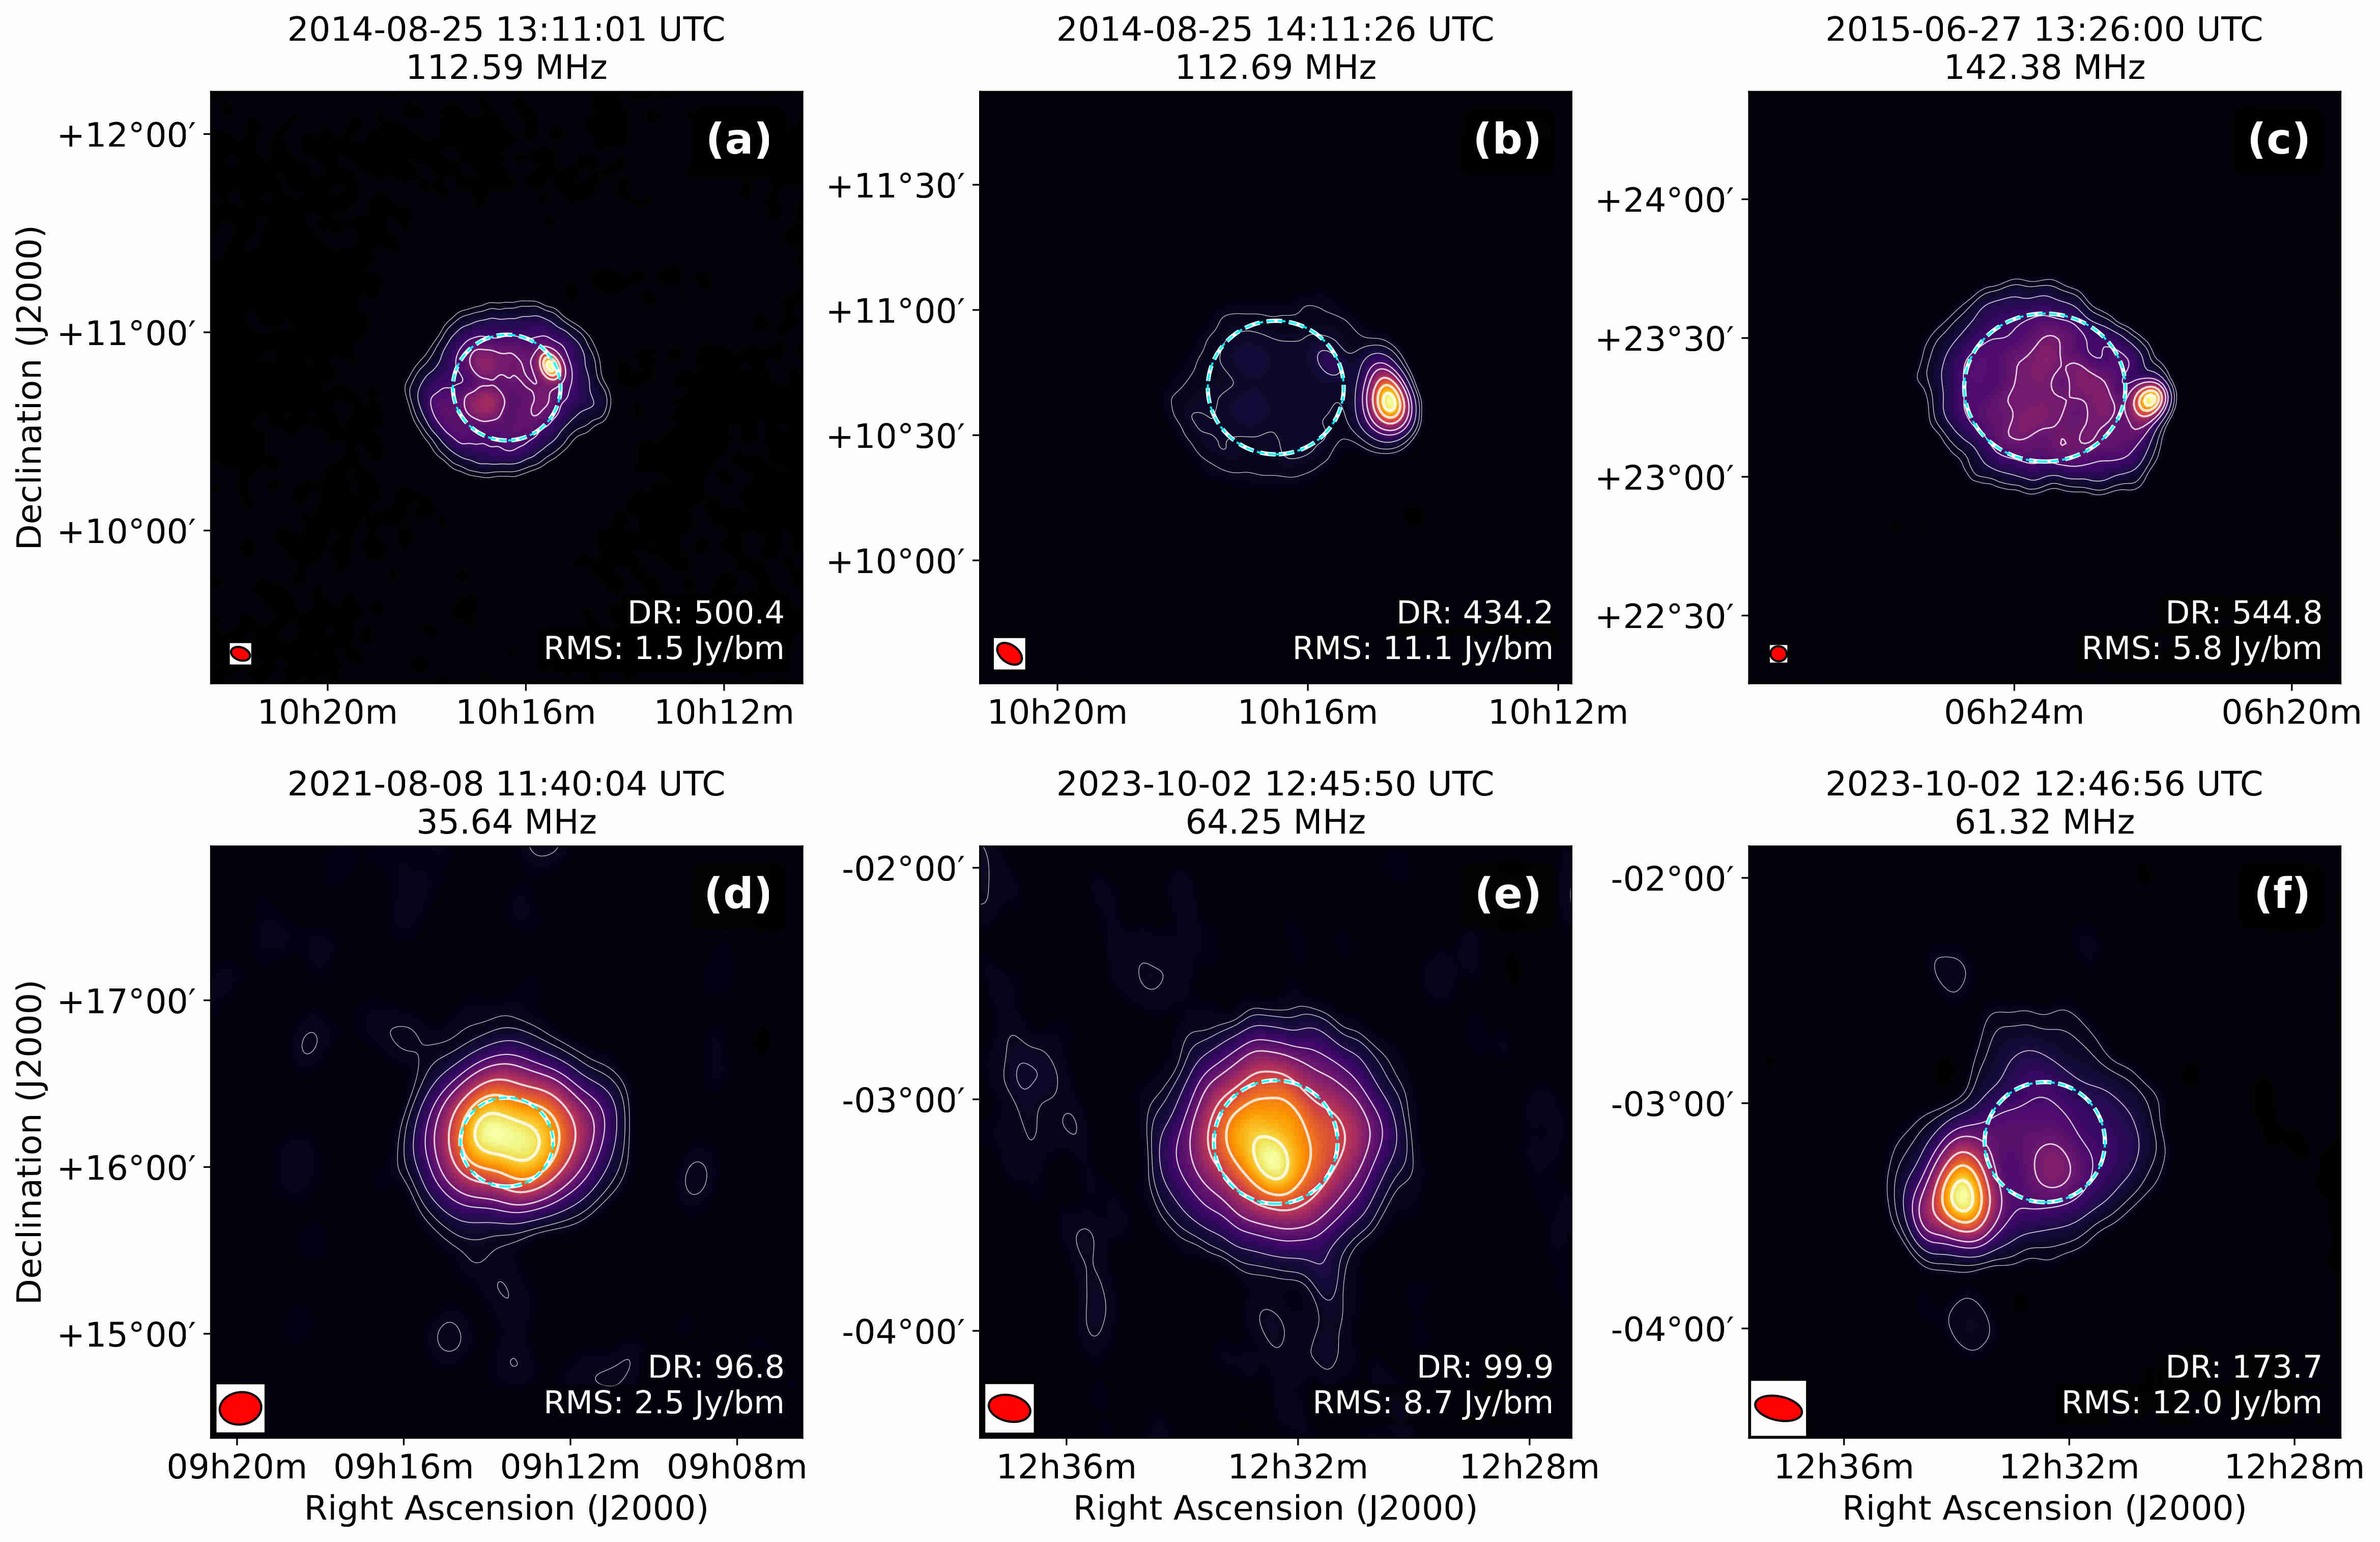
The LOw Frequency ARray (LOFAR) is capable of imaging spectroscopy of the Sun in the 10─240 MHz frequency range, with high spectral, temporal, and spatial resolution. However, the complex and rapidly varying nature of solar radio emission ─ spanning several orders of magnitude in brightness and further exacerbated by the strong ionospheric phase distortions during daytime observations, poses major challenges for calibration, imaging, and automation. In this work, Dey et al. (2025) present a fully automated, high-fidelity imaging pipeline optimised for LOFAR solar observations, capable of handling the intrinsic variability of solar emission and producing science-ready images with minimal human intervention. This pipeline, christened “Solar Imaging Pipeline for LOFAR” (SIMPL), integrates excision of radio-frequency interference (RFI) for the solar-specific scenarios, calibration strategies, and self-calibration. Currently, SIMPL can process data from the LOFAR core stations and produces total-intensity solar images. It is designed to enable scalable and uniform processing of large archival datasets. SIMPL has been tested across a wide variety of solar conditions and has been shown to reliably produce high-quality spectroscopic snapshot images providing an improvement of more than an order of magnitude in the imaging dynamic range when compared to previous efforts. The figure shows examples of spectroscopic snapshot images produced by SIMPL in its default mode (typically averaged over 1 s and 195 kHz). The dashed line marks the optical solar limb, the ellipse at the bottom-left marks the restoring beam, and the contours are at 3%, 5%, 10%, 20%, 30%, 50%, 70%, and 90% of the maximum intensity. SIMPL is currently being employed to process a decade of LOFAR solar observations, providing science-ready images for the community and enabling both comprehensive and novel studies of solar radio phenomena.
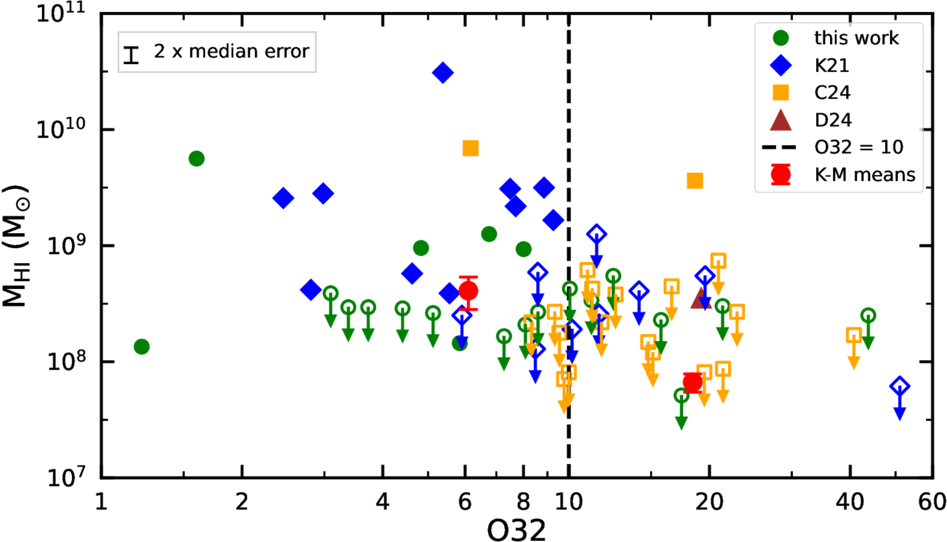
The Atomic Gas Properties of Green Pea Galaxies: Connections to Lyman Continuum Leakage
Green Pea galaxies (GPs) are local analogs of the dwarf starburst galaxies that reionized the Universe at early times via their Lyman-continuum (LyC) photons, and thus provide the opportunity to probe the processes by which such LyC photons might escape the early galaxies. Khasnovis et al. report a Green Bank Telescope (GBT) search for HI 21 cm emission from 30 low-redshift Green Pea galaxies (GPs), obtaining 7 detections of HI 21 cm emission and 17 upper limits on the HI mass. Including GPs from the literature, they compile a sample of 60 GPs at z<0.05, with 19 detections and 41 nondetections of HI 21 cm emission and with stellar masses in the range 0.001-1 million solar masses. They use the line luminosity ratio O32 = [O III]λ5007 + λ4959/[O II]λ3727,3729 as an indicator of LyC leakage and examine the dependence of the HI properties of the 60 GPs on the O32 ratio. They obtain a far higher HI 21 cm detection rate for the 32 GPs with O32<10 than that for the 28 GPs with O32>10. They also find statistically significant evidence that the HI mass, the HI-to-stellar mass ratio, and the HI gas depletion timescale of GPs with O32>10 are lower than the corresponding values for GPs with O32<10. Earlier studies have shown that galaxies with O32>10 tend to show significant LyC leakage. The new results indicate that this LyC leakage is due to the paucity of HI in such galaxies, with most of the HI consumed in the starburst. The results further suggest that HI 21 cm studies of the galaxies that reionized the Universe at early times are likely to find an anticorrelation between the HI 21 cm and Lyα emission signals, due to the paucity of HI in the strongest LyC and Lyα leakers. The figure shows the HI mass, or the 3-sigma upper limits to the HI mass, plotted against the O32 ratio for the 60 GPs of the sample. The dashed vertical line indicates the value O32=10, above which galaxies are expected to show significant LyC leakage. The filled and open symbols indicate, respectively, detections and nondetections of HI 21 cm emission. The green circles indicate GPs from the study of Khasnovis et al., and the other symbols indicate GPs from the literature. It is clear from the figure that GPs with O32<10 show both more detections of HI 21 cm emission and higher HI masses than GPs with O32>10.
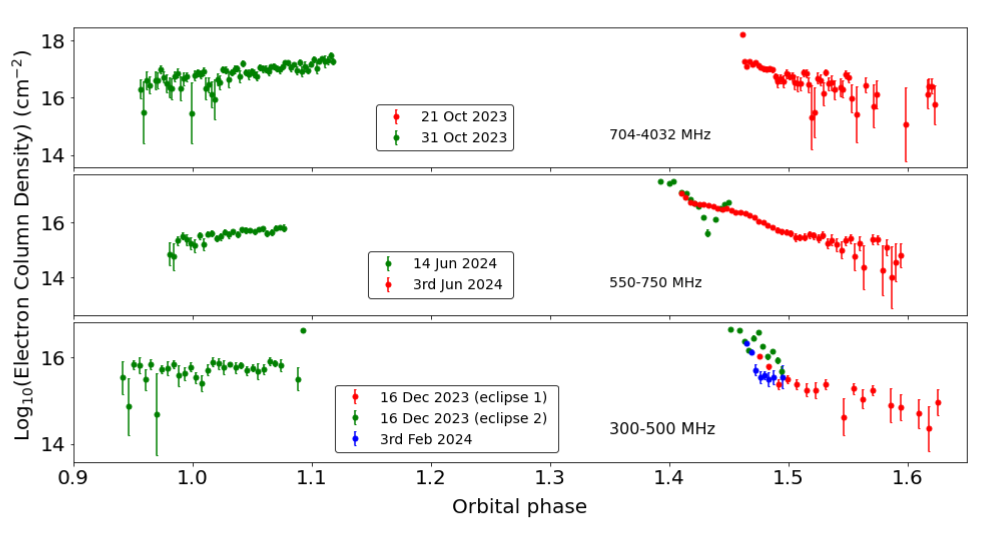
Exploring Unusual High-frequency Eclipses in MSP J1908+2105
Spider millisecond pulsars (MSPs) are compact binaries in which the energetic pulsar wind ablates the companion; eclipses occur when this ablated material blocks the pulsar’s radio beam. These eclipses are frequency-dependent, and typically vanish above a characteristic eclipse cutoff frequency (around 1.4 GHz). Using wide-band uGMRT Band-3 (300–500 MHz) and Band-4 (550–850 MHz) observations, together with Parkes UWL (704–4032 MHz) observations, Ghosh et al. show that PSR J1908+2105 remains eclipsed up to 4 GHz for >30% of the orbit, making it one of only three MSPs known to eclipse at such high frequencies. Orbital-phase–resolved dispersion and polarization measurements imply a dense, magnetized eclipse medium with excess line-of-sight dispersion measure of ~4 pc per cc and electron column density of ~10^{19} per sq. cm; rotation-measure (RM) variations indicate stronger line-of-sight magnetic fields toward the eclipse boundaries, with a characteristic field of ~16 G near the eclipse center. Ghosh et al. show that only synchrotron absorption can account for such high-frequency eclipses. They report the first evidence of temporary magnification of the pulsed flux density (about four times higher than in the non-eclipse phase) near eclipse edges, attributing the magnification to plasma lensing by irregular, strongly structured circumstellar plasma around the companion, where steep electron-density gradients refract and focus the pulsar’s radio emission. Numerous single bright pulses were found immediately before and after the eclipse, especially during egress, while none were seen outside the eclipse region. Combining with literature cases, the authors note that eclipse cutoffs above ~1 GHz are consistently linked to electron column densities greater than around 10^{17} per sq. cm, offering a physical handle on the eclipse medium across spider MSPs. The figure shows electron density variation near the eclipse boundary at different epochs observed with uGMRT at 400 MHz and 650 MHz, and with Parkes UWL at 2368 MHz. A sharp dip around orbital phase ∼ 1.42 on 14 June 2024 suggests a localized gap in the ionized gas, probably caused by turbulence in the plume. The absence of this dip in data from 11 days earlier indicates variability in timescales of days to weeks, showing the turbulent eclipse medium.
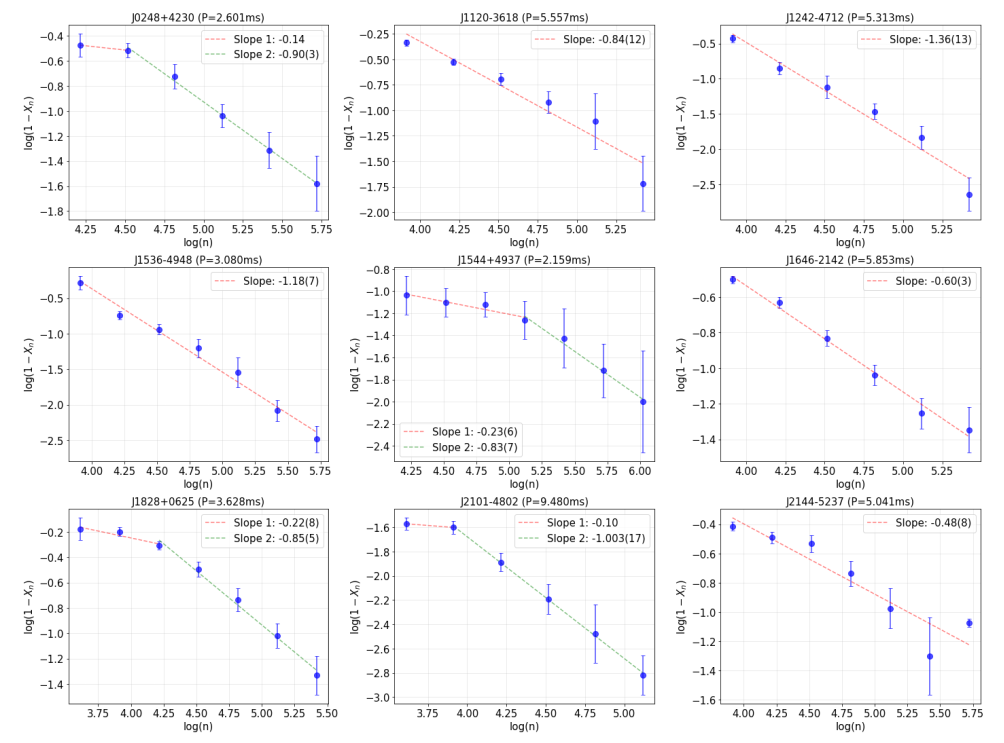
Deciphering Profile Stability in Millisecond Pulsars: Timescales, Frequency Evolution, and Implications for Emission Mechanisms
Millisecond pulsars (MSPs) enable precision timing, but their individual pulses show jitter -- random pulse-to-pulse changes in shape and phase that introduce a source-intrinsic white-noise term in timing. The jitter parameter is a dimensionless measure of how strong this effect is (a smaller value of the jitter parameter indicates steadier pulses). This study introduces a direct pulse-stacking method to measure how quickly the mean profile becomes stable. Using long-term, multi-epoch uGMRT observations at 300-750 MHz for nine MSPs, and complementary Parkes UWL data (704-4032 MHz) for a few of them, Ghosh et al. found that profiles typically require averaging a million pulses to stabilize. This stabilization rate depends on signal-to-noise ratio and pulse morphology, and shows a moderate link with surface magnetic field strength. Estimation of the jitter parameter is feasible for relatively bright sources with sufficiently high single-pulse signal-to-noise ratio. In this context, Ghosh et al. also found that the measured profile-stability slope correlates with this parameter, providing a practical proxy for intrinsic pulse-shape variability in faint MSPs and helping set integration times for Pulsar Timing Array experiments. The figure summarises the long-term profile stability for nine GMRT-discovered MSPs from multi-year observations. The plot shows the mean correlation between sub-averaged and global profiles versus pulse number, demonstrating that MSP profiles stabilise after averaging around a million pulses. Here, n denotes the number of individual pulses that have been averaged to form a subaveraged pulse profile. For each value of n, we compute the Pearson correlation coefficient Xn between the sub-averaged profile and the global profile. The quantity plotted is log(1 − Xn) as a function of log(n), capturing the stabilization behavior of pulse profiles with increasing averaging. The vertical error bars represent the standard error of the mean of Xn at each n, propagated through the logarithmic transformation. The slope of the fitted line shows the profile stability rate.
Observation and Modeling of Small Spatial Structures of Solar Radio Noise Storms Using the uGMRT
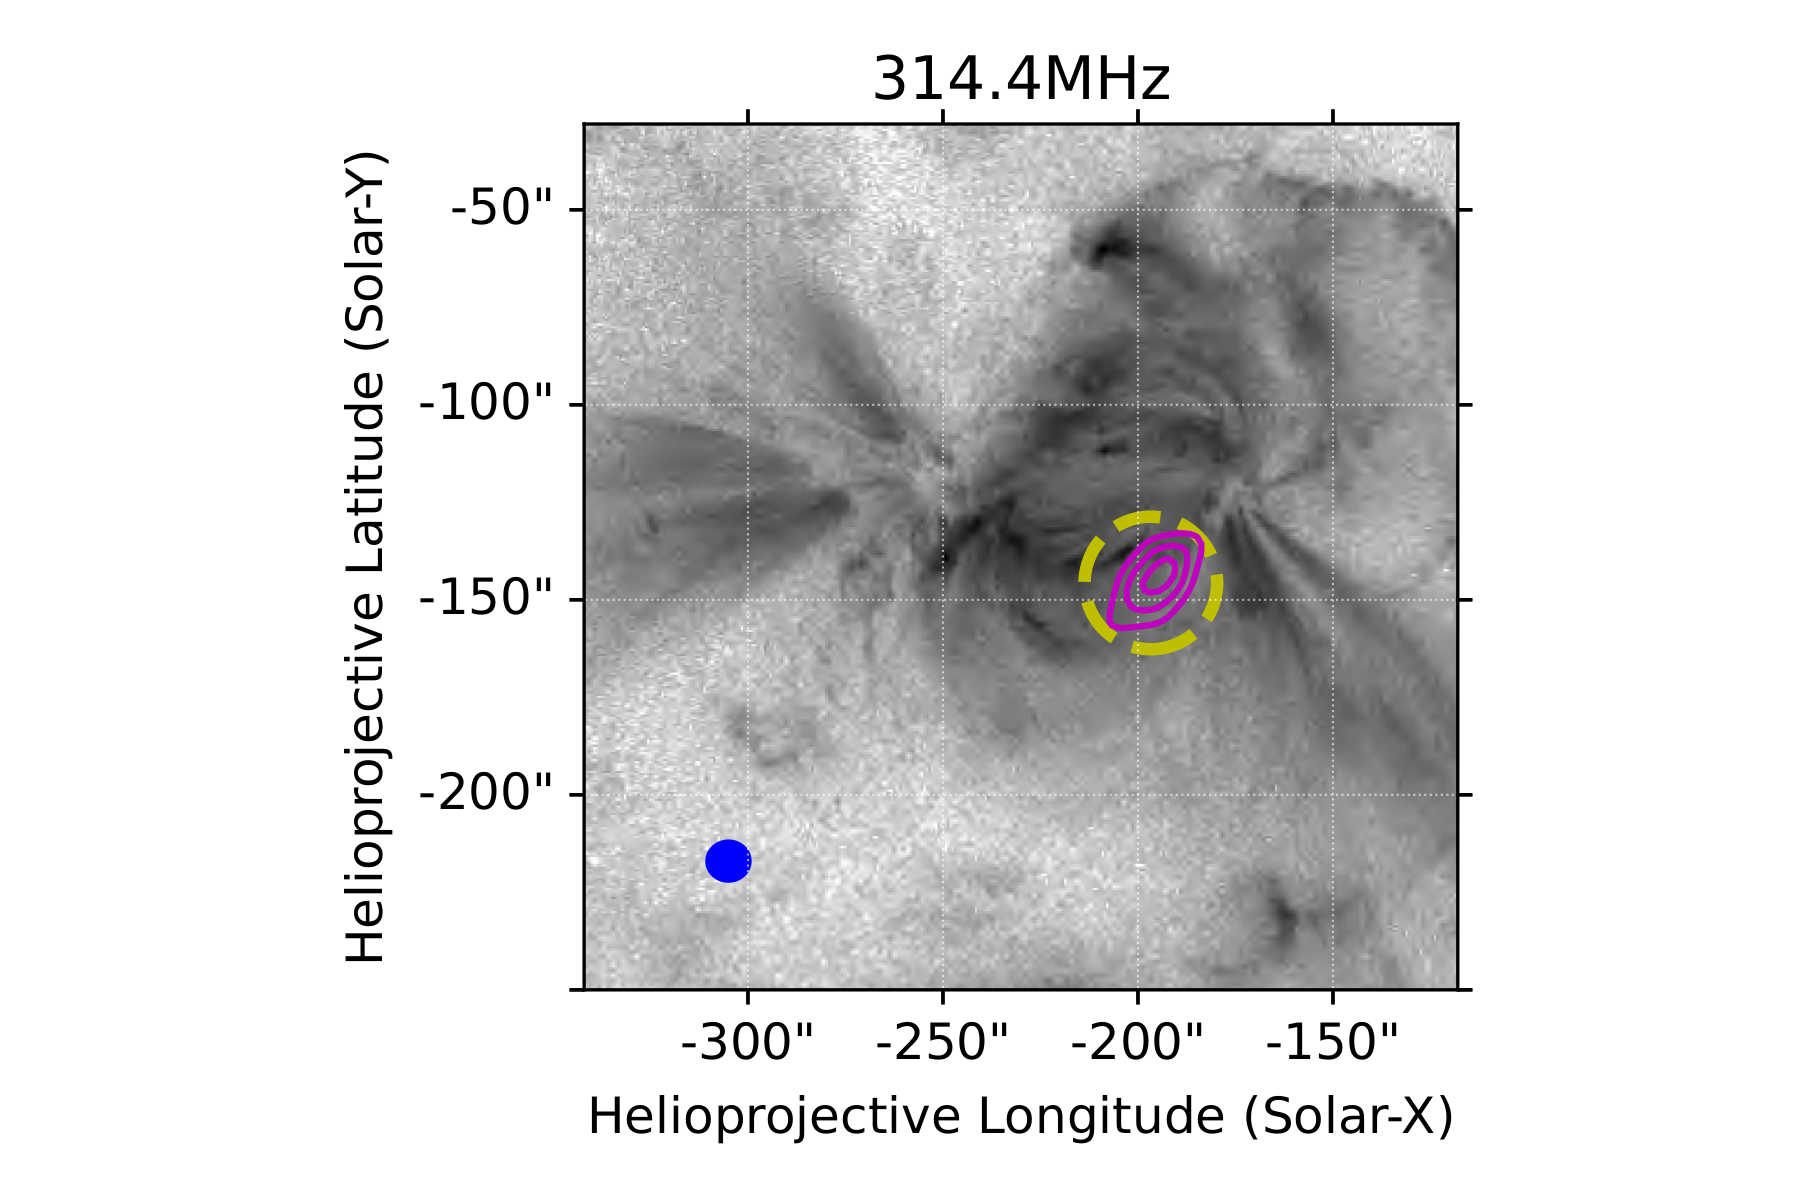
Among the most commonly observed solar radio sources in the metric and decametric wavelengths are the solar noise storms. Powered by a plasma emission mechanism, noise storm sources can become significantly scatter-broadened due to the multi-path propagation caused by refraction from the coronal density inhomogeneities. Scatter-broadening imposes a fundamental limit on the minimum observable source size in the solar corona. While past observational and theoretical works have tried to estimate this limiting size, the limit depends on the details of the coronal turbulence model. As such, pushing the minimum observable source size to smaller values can help constrain the plasma environment of the observed sources as well as the models of coronal turbulence. In this work, Mondal et al. (2025) use data from the upgraded Giant Metrewave Radio Telescope in the 300-500 MHz band to determine, for the first time, multiple instances of structures with length scale of approximately 20\" in noise storms. These sources are much smaller than structures reported earlier in the corona at similar frequencies. These small sources are stable over timescales of 15-30 minutes and are detected over the entire available bandwidth of about 200 MHz. The adjacent figure shows an example of a noise storm source, in the magenta contours. The radio image was generated by integrating 24 MHz and 25 minutes of data. The size of the source was estimated by fitting the region bounded by the yellow dashed circle by a Gaussian, and found to be 30\" x 16\". Such small source sizes are very hard to explain using the currently prevalent coronal turbulence models. To understand the origin of such small sources, Mondal et al. also build an illustrative model. They demonstrate that it is easier to account for the existence of such small sources if they originate in coronal loops, which are much denser than the background coronal plasma.
Globular Clusters GMRT Pulsar Search (GCGPS). I. Survey Description, Discovery and Timing of the First Pulsar in NGC6093
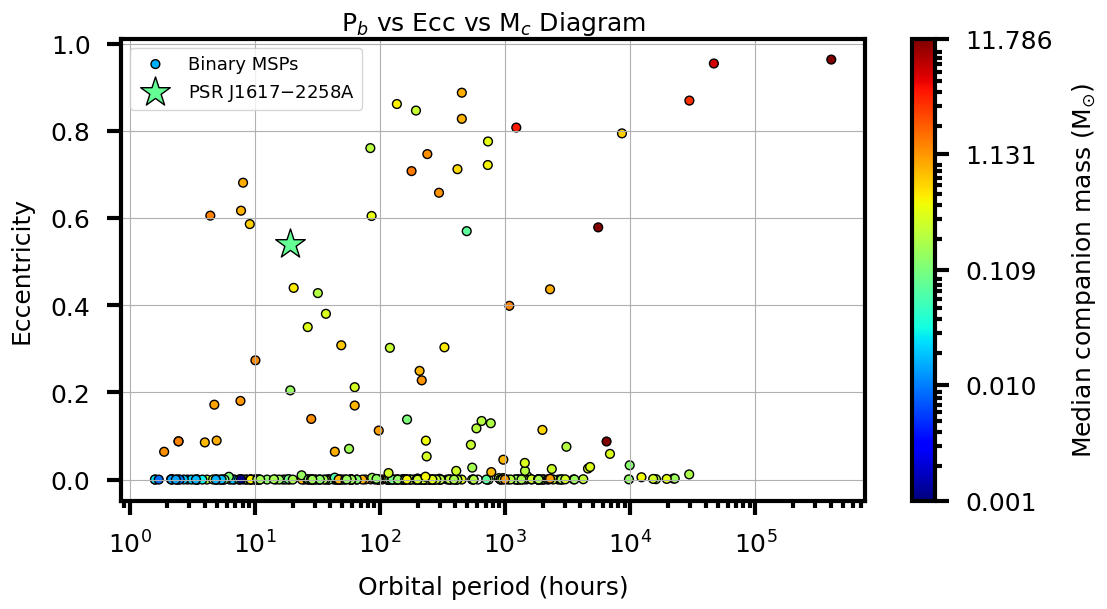
Globular clusters are among the oldest and most compact stellar systems in the Galaxy, where the high stellar densities facilitate frequent dynamical encounters, often leading to the formation of exotic compact binary systems. These systems are predominantly situated at higher Galactic latitudes. Using the Globular Clusters GMRT Pulsar Search (GCGPS), a new low-frequency survey with the upgraded Giant Metrewave Radio Telescope (uGMRT), Das et al. (2025) reported the discovery of the first pulsar in NGC 6093. The source, designated PSR J1617−2258A, is a rapidly spinning millisecond pulsar with a rotation period of just 4.32 milliseconds. It resides in an unusually eccentric (e ~ 0.54) binary system with an orbital period of ~ 19 hours and a low-mass (Mc ~ 0.082 ± 0.06 M⊙) companion, most likely a helium white dwarf. The figure illustrates that this system occupies a distinct region of parameter space, characterised by its unusually low companion mass and high orbital eccentricity relative to all other known pulsar binaries. Only four such systems have greater orbital compactness and higher eccentricity, but all of them have a median companion mass lower than that of PSR J1617−2258A. Such high orbital eccentricity strongly suggests a dynamical formation history – either through the replacement of the pulsar’s original companion during a stellar exchange encounter in the dense cluster core, or via perturbations to its orbit caused by a close flyby of another massive star or compact object. A precise timing solution was achieved after over a year of follow-up observations, which enabled the detection of the relativistic advance of periastron, an orbital precession arising from general relativistic effects. This measurement yields a total system mass of 1.67 +/- 0.06 solar masses, providing important constraints on both the nature of the companion and the pulsar’s mass. The discovery was enabled by the dual-beam phased-array mode of the uGMRT in Band 4 (550–750 MHz), which offers simultaneous, high-sensitivity coverage of both the entire globular cluster and its dense core. When combined with rapid positional refinement via interferometric imaging, this capability underscores the efficacy of the GCGPS in detecting and accurately characterising new pulsars within globular clusters.
Low-frequency, wideband study of an active repeater, FRB 20240114A, with the GMRT
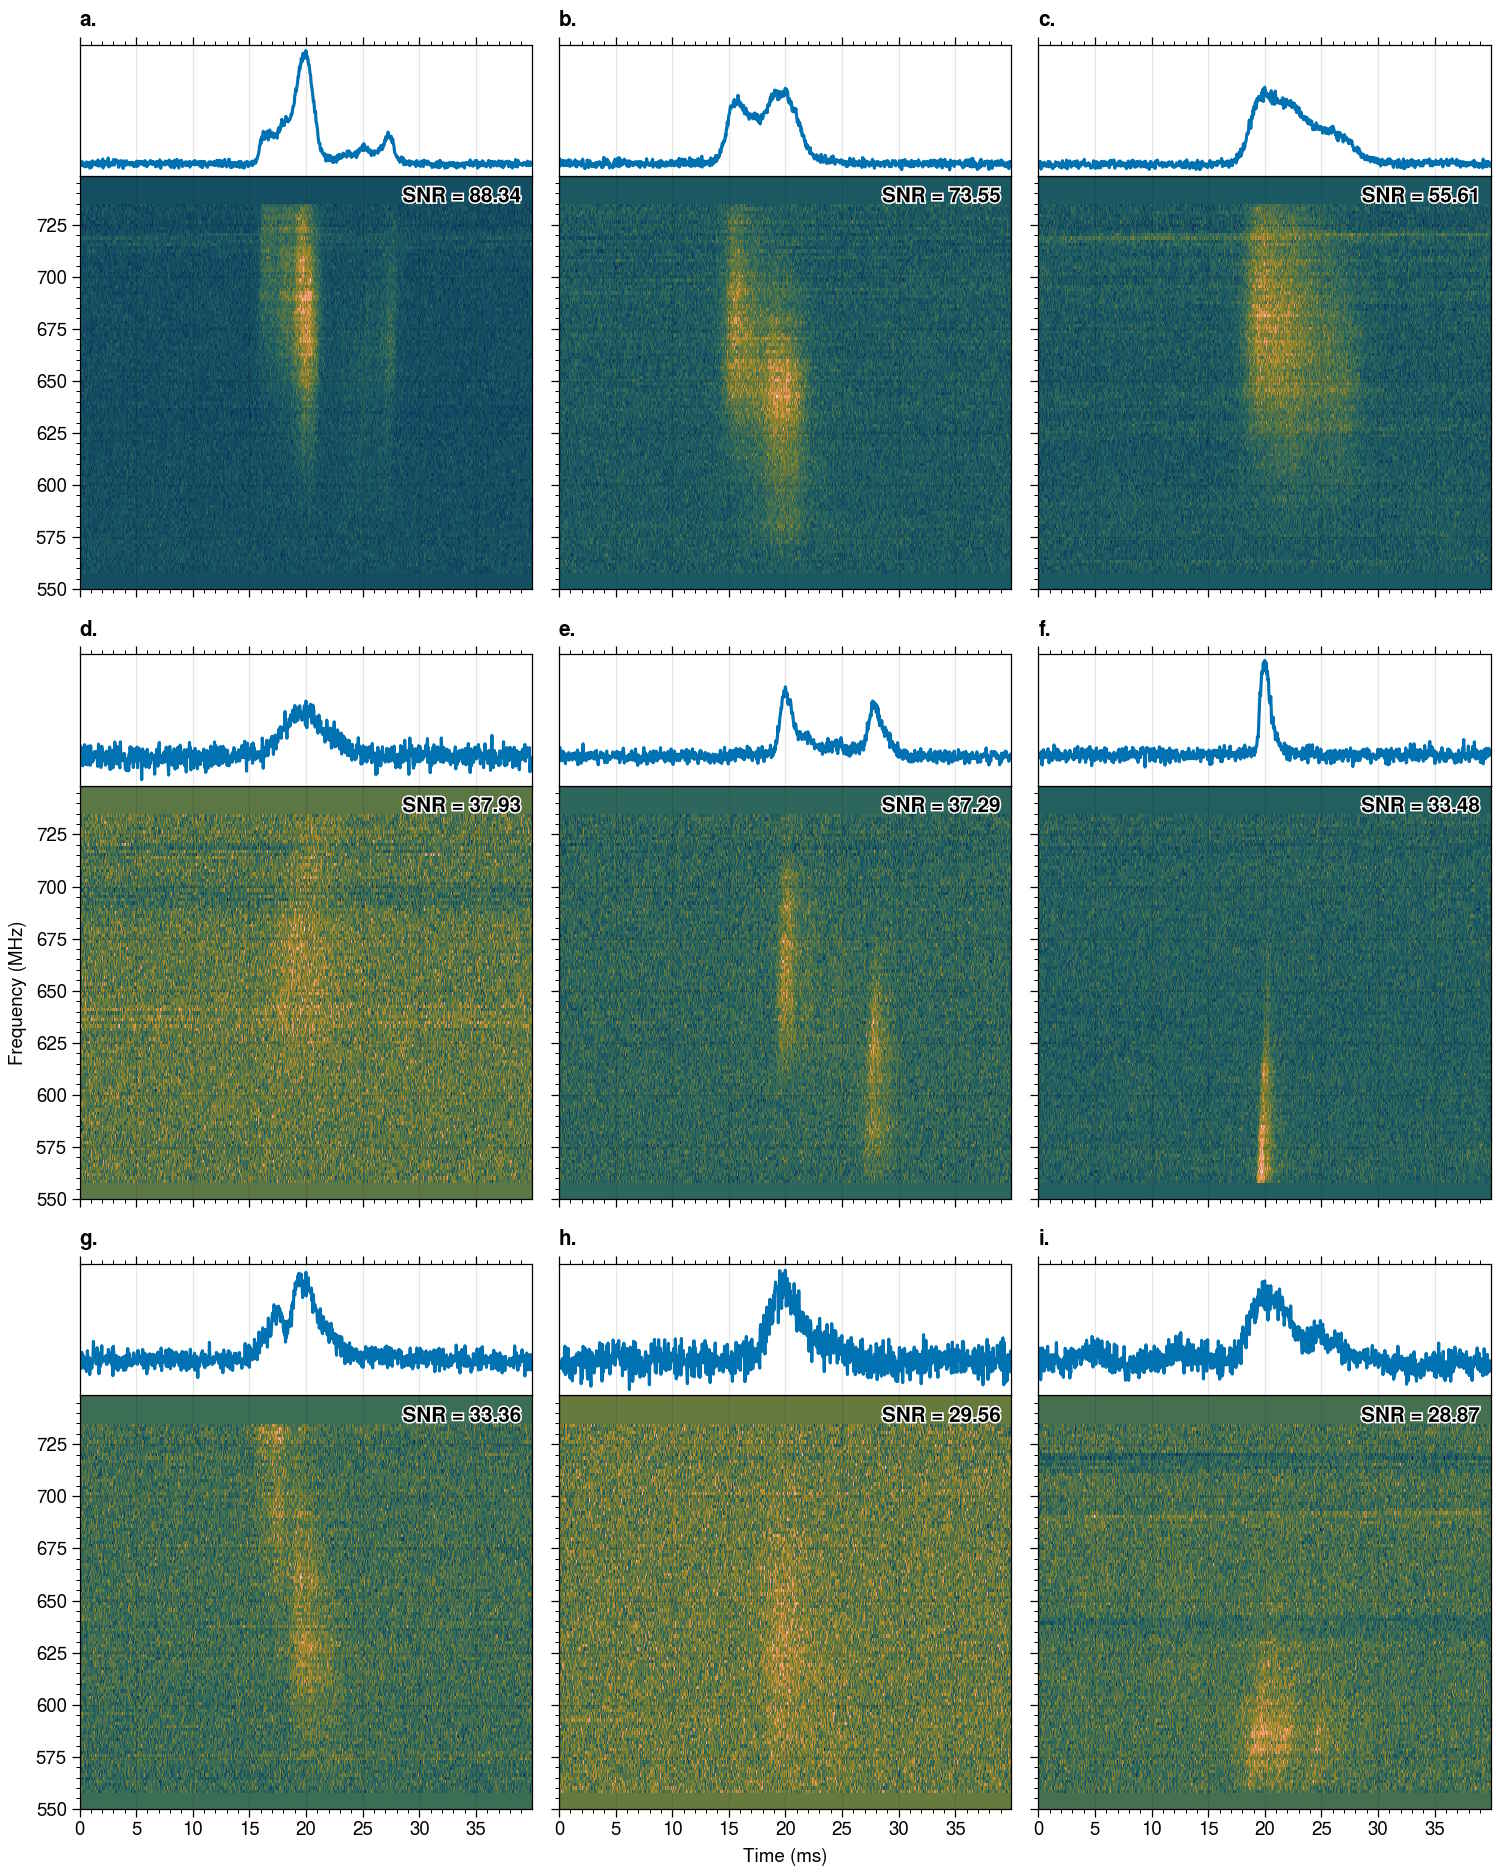
Fast radio bursts are transient sources in the radio sky. Their emission is known to be wideband, coherent, and bright over very short timescales (from hundreds of microseconds to a few milliseconds). While most of these are one-off events, a small fraction emit repeatedly. An even smaller fraction of FRBs emit at rates of over 1 burst per hour, and are thus known as hyperactive repeaters. Panda et al. 2025, presented the study of the most prolific hyperactive FRB to date, FRB 20240114A, with the upgraded GMRT. The authors reported the detection of 167 bursts over a six-month period (i.e. 25/02/2024 to 13/07/2024), spanning a frequency range of 300 to 750 MHz. This dataset enabled an analysis of the distributions of various burst parameters and allowed the authors to examine their evolution over both time and frequency. The dedispersed dynamic spectra for the nine brightest bursts are presented in the figure, revealing a range of burst morphologies, including band-limited emission, multiple components, and sub-burst frequency drifts. The properties of the detected bursts vary widely, with a wide range of intrinsic widths (0.246 - 39.364 ms), scattering timescales (0.004 - 28.289 ms), and dispersion measures (524.07–533.56 pc per cc). The majority of the bursts were band-limited as well, with 56% of the bursts with a band occupancy of 50% or less. Band occupancies varied widely, from 9 (4.5%) to 180 MHz (about 90%). Their bi-modal waiting time distribution indicates that the emission from the FRB is non-Poissonian. Panda et al. 2025 lso reported that the isotropic energy distribution flattens at higher energies for the detected bursts, along with a gradual decline in their flux over time. These results could provide important constraints on the emission mechanism of this FRB.
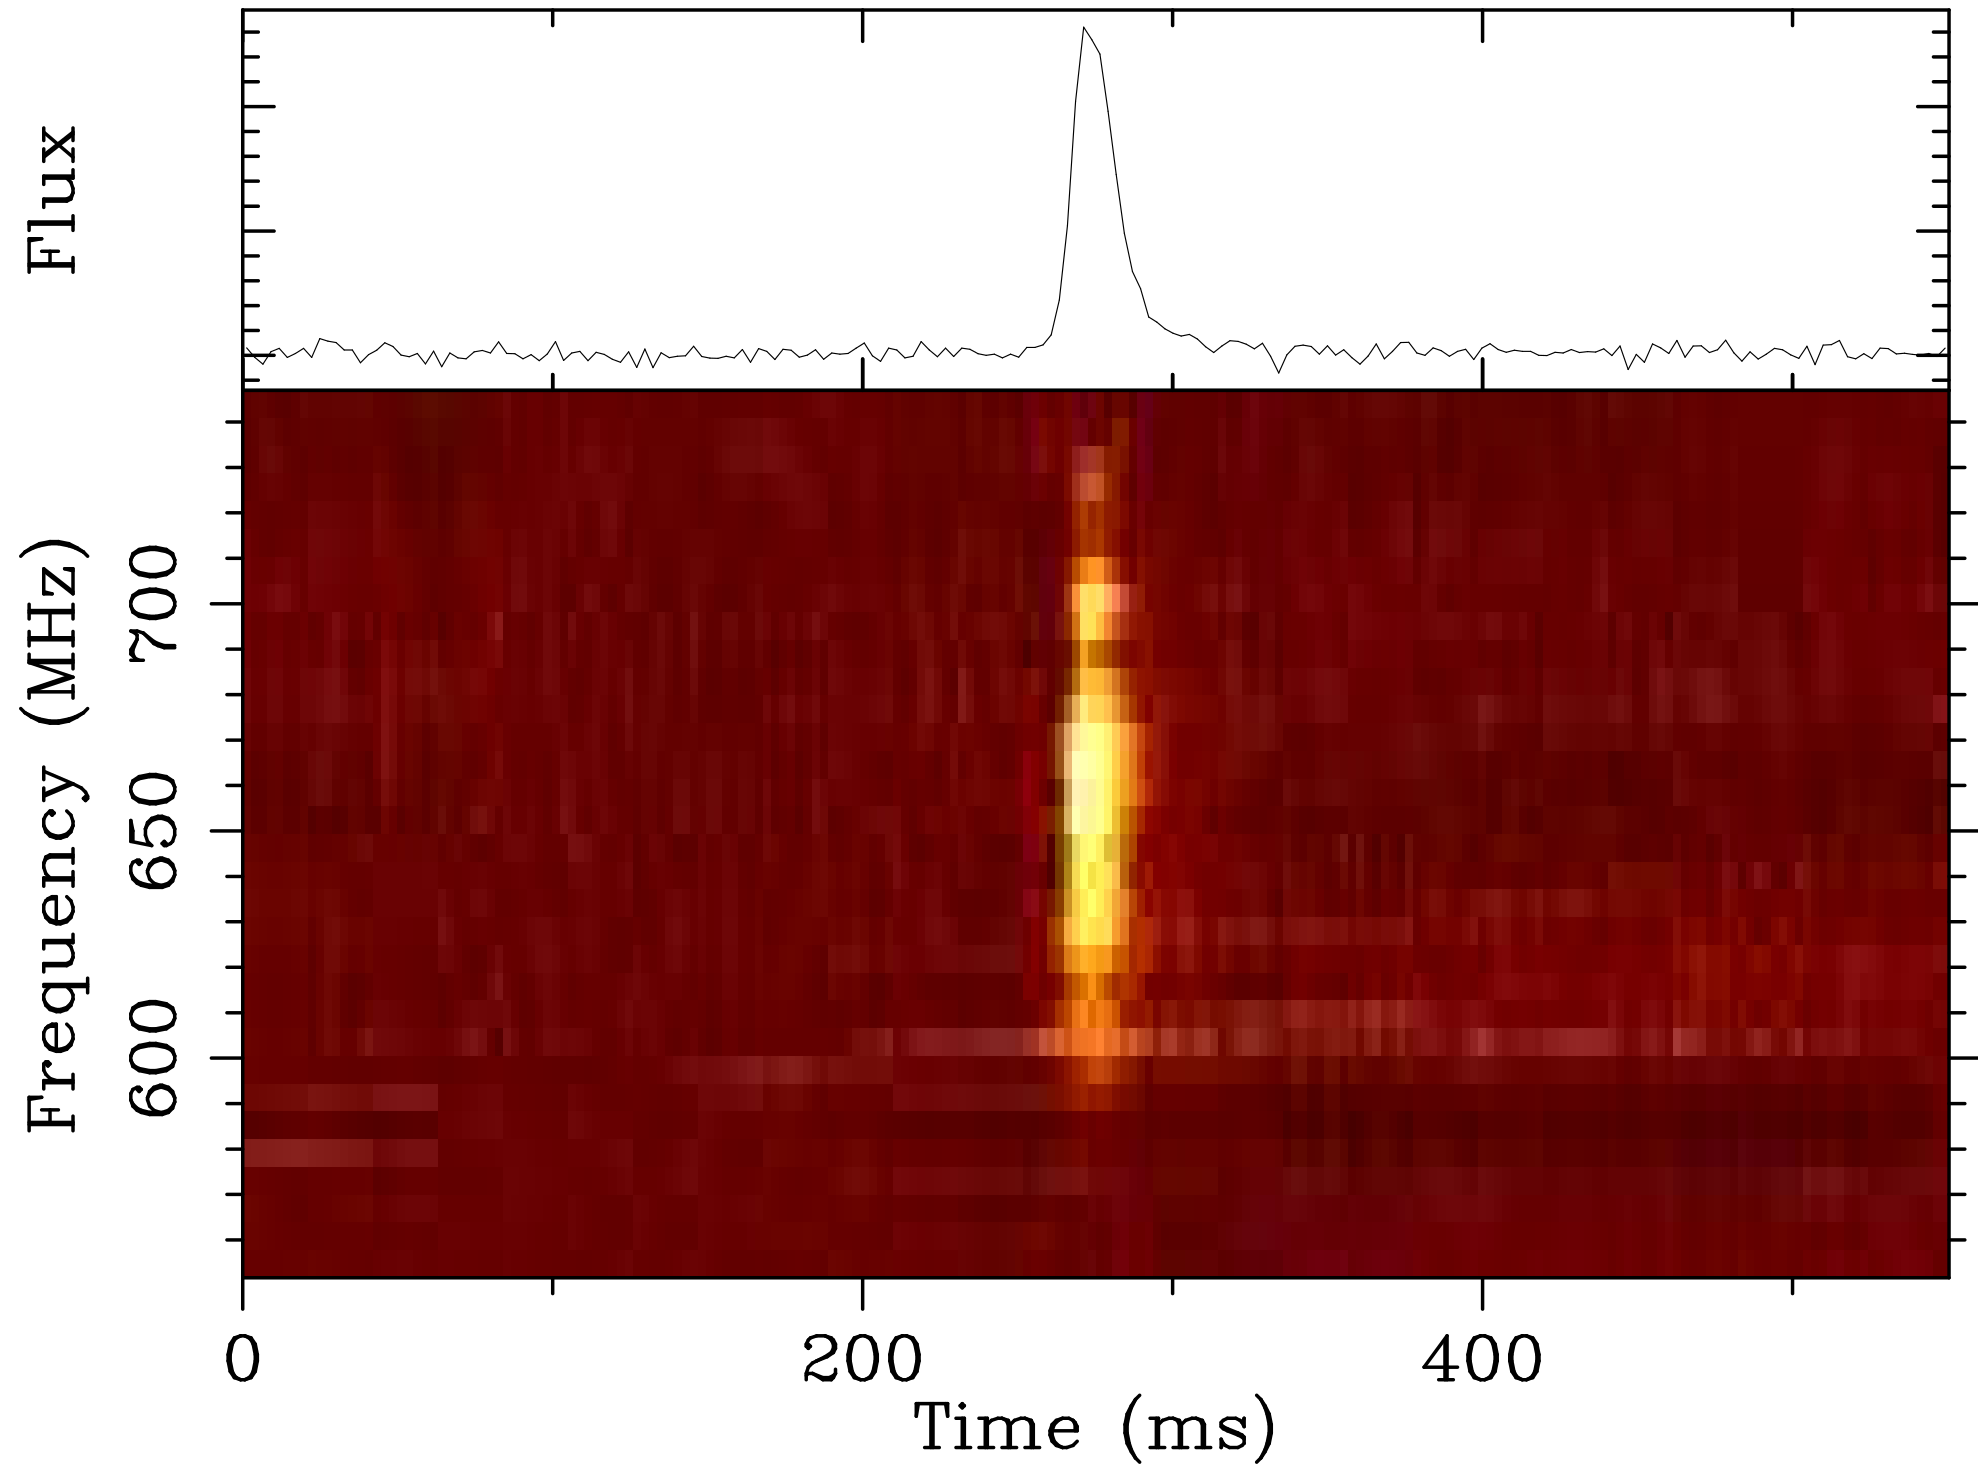
An activity transition in FRB 20201124A: Methodological rigor, detection of frequency-dependent cessation, and a geometric magnetar model
The repeat nature of some of the fast radio bursts (FRBs) enables a multitude of studies using sensitive telescopes to probe their origins and emission mechanisms. Bilous et al. utilized coordinated observations using GMRT and WSRT to study the repeating FRB 20201124A. Using primarily the GMRT observations and earlier published contemporary FAST observations, we showed that FRB 20201124A exhibits a frequency-dependent activity window. Before this FRB, only FRB 20180916B was known to show such frequency dependence. Using our data as well as other published results on this particular source, it was conjectured that the source of FRB 20201124A is an ultra-long period magnetar and the bursts might have been caused by crustal motion events. It was also shown that the excess dispersion measure (DM) reported for the bursts from this source might have been biased by the sad trombone effect and such biases are hard to avoid unless the signal-to-noise ratio is extremely high. The brightest burst detected with GMRT is shown in the accompanying figure.