Science Highlights
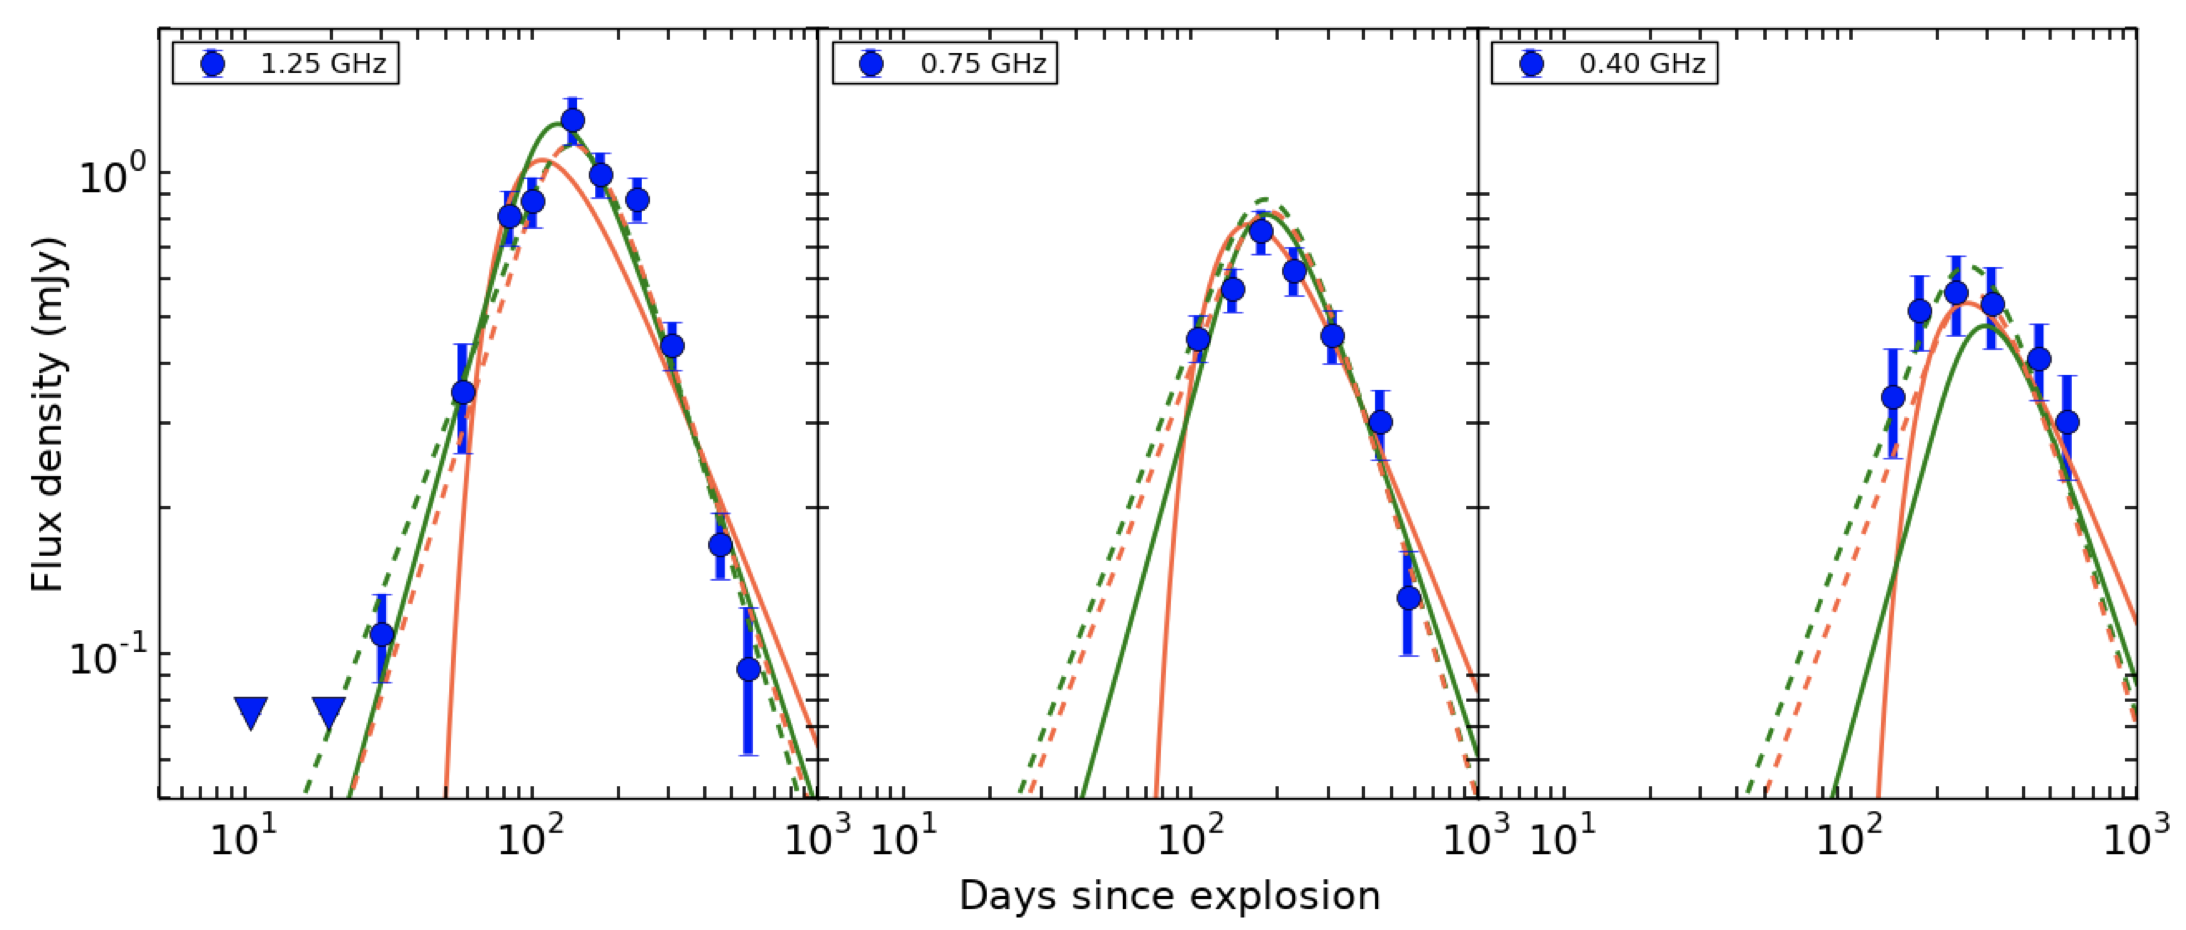
Insights into the progenitor system of the fast blue optical transient AT2018cow via uGMRT observations
Nayana & Chandra report low-frequency radio observations of the fast-rising blue optical transient, AT 2018cow, with the upgraded Giant Metrewave Radio Telescope (uGMRT). They covered epochs from ~10-600 days post-explosion and a frequency range of 250-1450 MHz. The modeling of the radio data reveals an inhomogeneous radio-emitting region expanding into an ionized medium. They constrained various physical parameters of the explosion, such as the evolution of shock radius, shock velocity (v > 0.2c) and the mass-loss rate of the progenitor. The upper limit to the mass loss rate of the progenitor star, 50 years before the explosion, was a millionth of a solar mass per year. This is a hundred times smaller than the previously reported mass-loss rate 2 years before the explosion, indicating an enhanced phase of the mass-loss event close to the end of the life of the progenitor. The results are in line with the speculation of the presence of a dense circumstellar shell in the vicinity of AT 2018cow from previous radio, ultra-violet, and optical observations, and have important implications for these explosions. The figure shows the uGMRT light curves of AT 2018cow at 0.40, 0.75 and 1.25 GHz frequencies. The green and red solid lines denote the best fit SSA and FFA models respectively. The green and red dotted lines denote the best fit inhomogeneous SSA and FFA models, respectively.
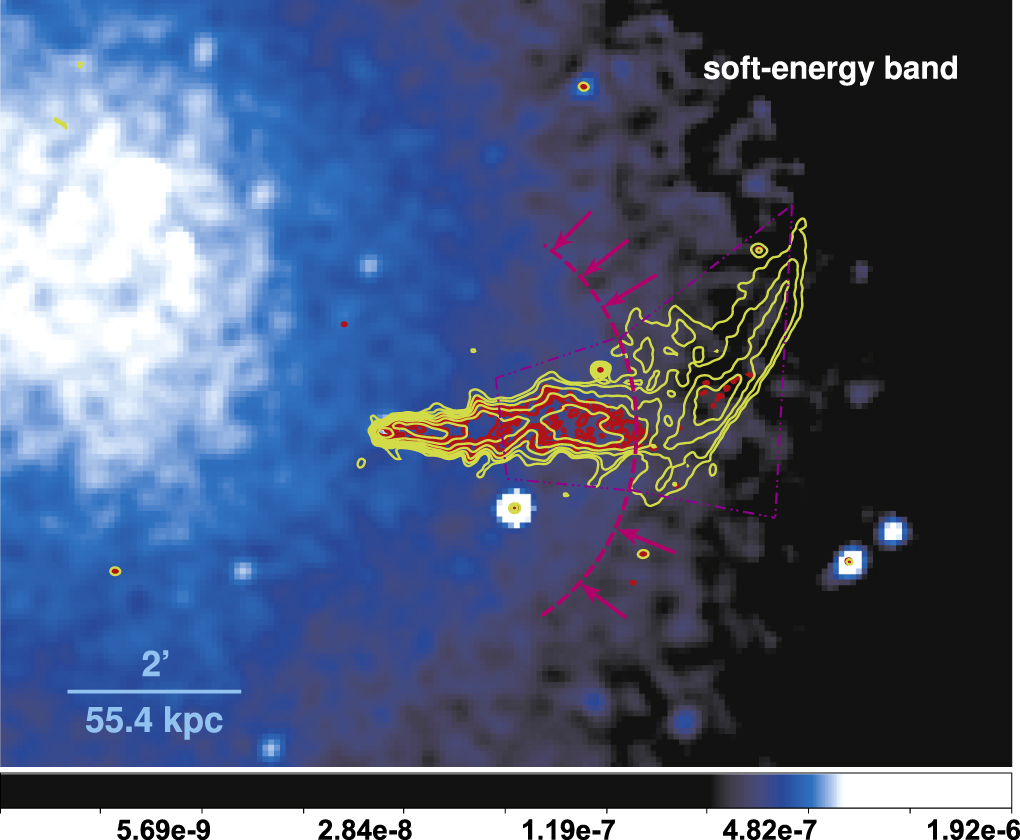
NGC 4869 in the Coma Cluster: Twist, Wrap, Overlap, and Bend
The author presents a detailed analysis of deep upgraded Giant Metrewave Radio Telescope (uGMRT) images of the head-tail radio galaxy NGC 4869 in the Coma cluster. The uGMRT images have an angular resolution of ~6.3 arcsecs and ~2.2 arcsecs, at frequencies of 250-500 MHz and 1050-1450 MHz, respectively. The author also used archival GMRT data to image the source, with angular resolutions ranging from 4.9 arcsecs to 21.8 arcseconds at 610 MHz, 325 MHz, 240 MHz, and 150 MHz. The uGMRT images show that the radio morphology of NGC 4869 consists of five distinct regions, with the clear presence of a pinch at a distance of 38.8 kpc, and a ridge at a distance of ~94.2 kpc from the head of the radio galaxy. The sharp bend by ~ 70 degrees at ~97 kpc from the head is possibly due to projection effects. There is possibly re-acceleration of the synchrotron electrons and perhaps also magnetic field regeneration in the ~2.8 - 96.1 kpc region of the jet. The author reports a steep-spectrum sheath layer enveloping a flat-spectrum spine, hinting at a transverse velocity structure with a fast-moving spine surrounded by a slow-moving sheath layer. He also derives the lifetimes of the radiating electrons and equipartition parameters. The figure shows the uGMRT 250-500 MHz (green) and 1050-1450 MHz (red) images of NGC 4869, overlaid on a Chandra X-ray image. The red arrows indicate the location of the onset of flaring, i.e. the surface brightness edge. The two radio jets emanating from the apex of the host galaxy initially travel in opposite directions. As the galaxy plows through the dense intracluster gas, these jets form a trail behind the host galaxy due to interaction with the intracluster medium, forming a conical shaped feature centered on the nucleus. Subsequently, the two jets twist, wrap, overlap and eventually bend. The radio spectra show progressive spectral steepening with distance from the head (i.e. the radio core), due to synchrotron cooling. A plausible explanation for the characteristic feature, the ridge of emission perpendicular to the direction of tail, is the flaring of a straight, collimated radio jet as it crosses a surface brightness edge (due to Kelvin-Helmholtz instabilities).
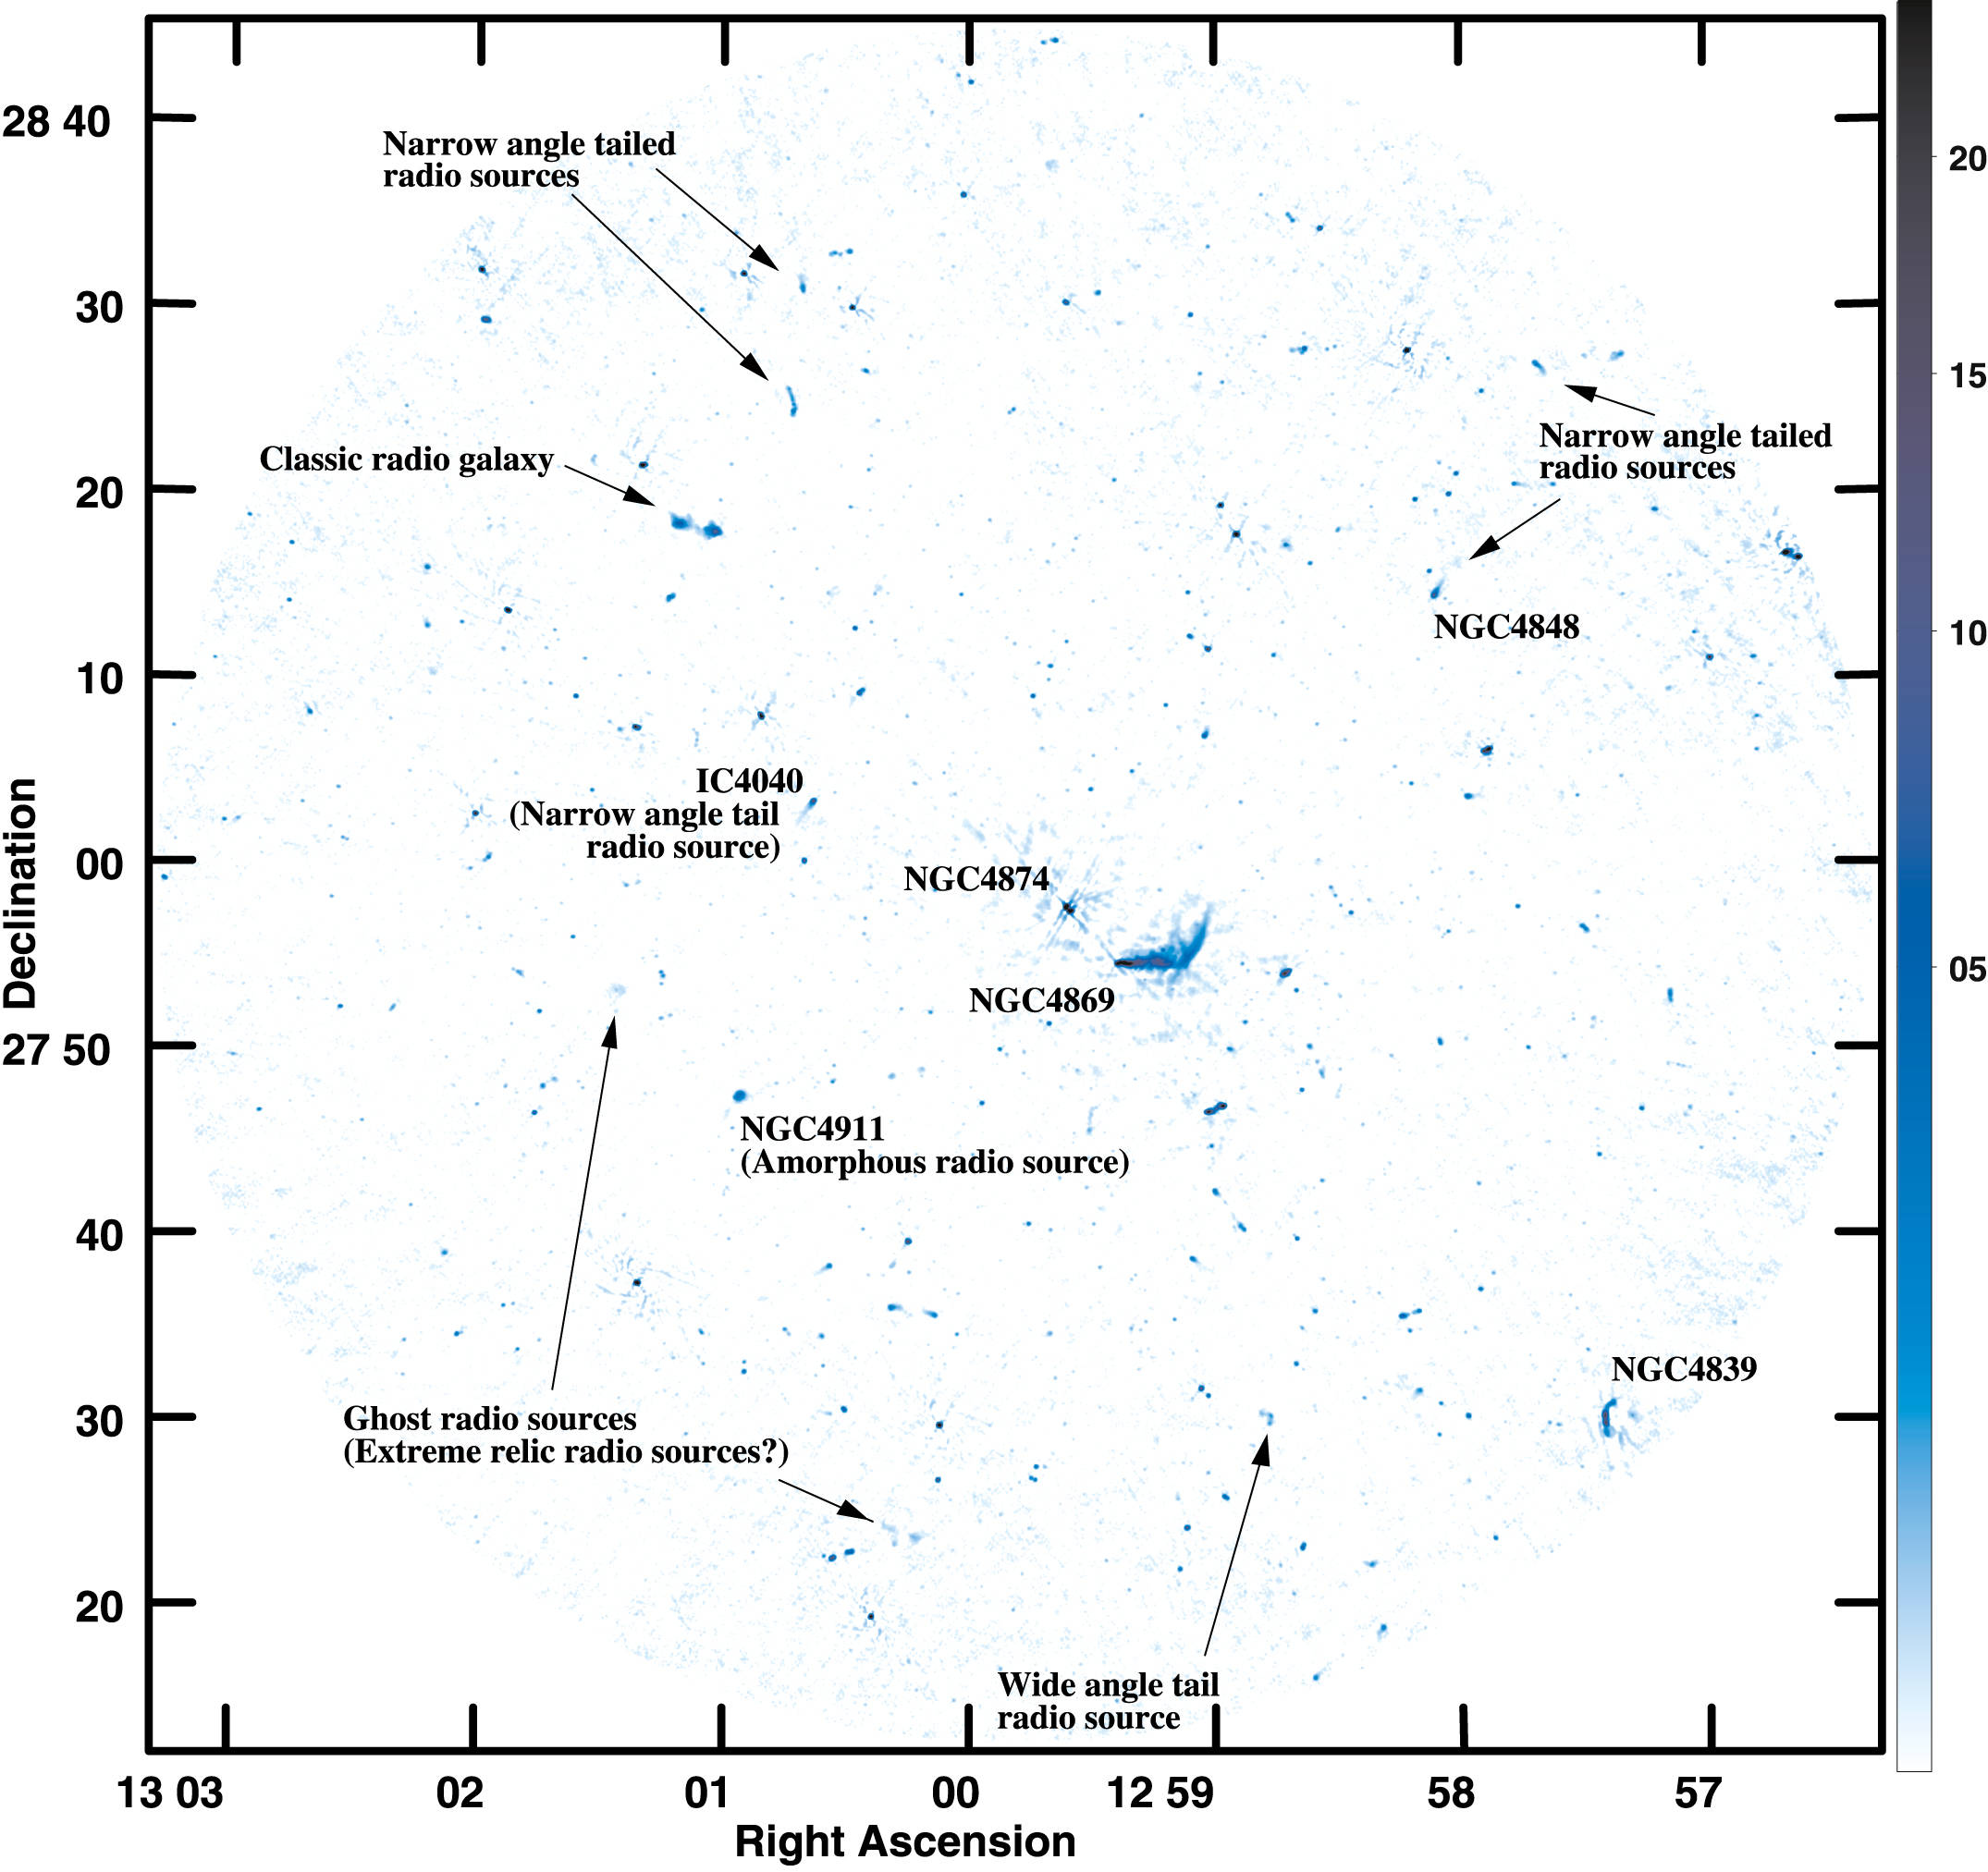
Upgraded GMRT Observations of the Coma Cluster of Galaxies: The Observations
The author used the upgraded Giant Metrewave Radio Telescope (uGMRT) to map the Coma galaxy cluster at two frequencies, covering 250-500 MHz and 1050-1450 MHz. Coma is the nearest large galaxy cluster to us, and shows a complex dynamical state in its X-ray emission. The high resolution (~6.3 arcsec and 2.2 arcsec, respectively) and high sensitivity (RMS noise of 21 microJy/Beam and 12.7 microJy/Beam, respectively) of the uGMRT images allow the radio structure to be determined for a large number of radio sources in the cluster, of both compact and extended morphologies. The author presents images and spectral index measurements for a subset of the 32 brightest sources of the cluster. He finds the steepening of the low-frequency radio spectra to be consistent with synchrotron cooling in the majority of sources. The median spectral index is -0.78, suggesting that ~60% of the sources have steep spectra. The deep uGMRT images presented here will enable detailed studies of the spectral properties, ages, and structures of individual radio galaxies within the cluster. The figure shows the 250-500 MHz uGMRT image, with 6.3 resolution and an RMS noise of 21 microJy/Beam; the image reveals a wide variety of radio morphologies for the detected radio sources, including a few new candidate extreme radio relics.
Tracing the evolution of ultraluminous infrared galaxies into radio galaxies with low frequency radio observations
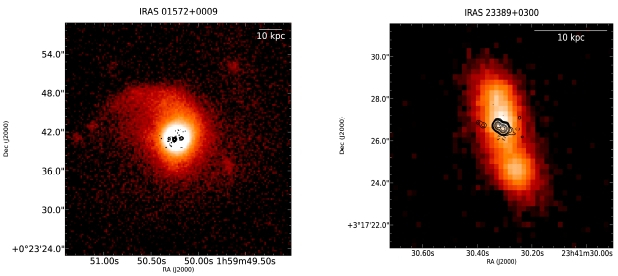
Ultraluminous infrared galaxies (ULIRGs) are gas rich merger remnants that are extremely luminous at infrared wavelengths. They represent the final stage of the merging process of two comparable mass, gas-rich galaxies that finally evolve into elliptical galaxies, and, in some cases, quasars. Nandi et al. observed 13 ULIRGs that have optically-identified characteristics of active galactic nuclei (AGNs) with the Giant Metrewave Radio Telescope (GMRT). The main goal is to study ULIRGs at low frequencies and identify any signatures of core-jet structures or extensions. This can help determine whether there is an underlying evolutionary connection between ULIRGs and young radio sources like Gigahertz Peaked Spectrum (GPS) sources, Compact Steep Spectrum (CSS) sources, and compact symmetric objects (CSOs). The authors find that ULIRGs can have signatures of outflows at low frequencies. They examined the radio spectral energy distribution of this sample and studied their optical spectra. The integrated radio spectra of 5 ULIRGs have low frequency turnovers, similar to those of young radio sources. A spectral ageing analysis shows that the ULIRGs are younger than the extended large radio sources or remnant radio sources. Archival high frequency radio data revealed classical double structure for 3 sources (see figure), while 4 sources show double-peaked emission lines, the latter likely to arise due to either dual AGNs or outflows. The estimated spectral age, spectral shape, and radio morphology of these ULIRGs indicates that they are young radio sources and possible progenitors of radio galaxies.
Double-peaked Lines, Dual VLBI Components, and Precessing Jets in J1328+2752
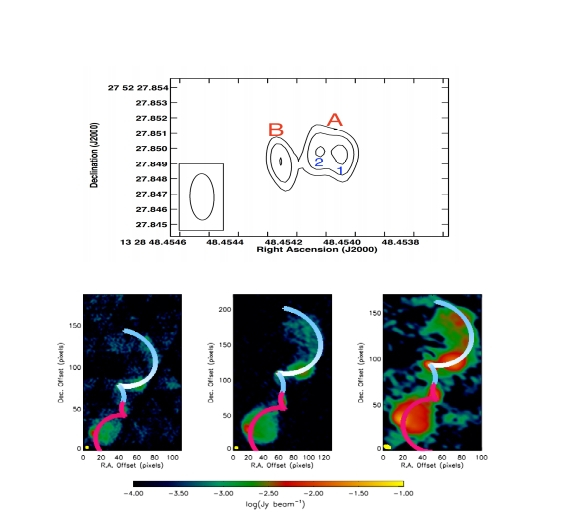
Nandi et al. use low-frequency Giant Metrewave Radio Telescope (GMRT) observations and Very Large Array Faint Images of the Radio Sky at Twenty centimeters (FIRST) images to identify a radio galaxy, J1328+2752, with symmetric helical jets. The Sloan Digital Sky Survey (SDSS) spectrum of the galaxy shows that the central component has double-peaked line profiles with different emission strengths. The authors use the BPT diagnostic diagram to distinguish the different classes of ionization, to find that the two components of the double-peaked emission lines may come from two active galactic nuclei (AGNs) that underwent a merger. Large-scale radio jets with a rotationally-symmetric helical modulation are also an indirect indicator of black hole binaries. However, the confirmation of such binaries typically requires multiple signatures at different wavelengths. The authors carried out very long baseline interferometry (VLBI) 5 GHz imaging and kinematic precession modeling of this radio galaxy. The VLBI image reveals a core-jet structure (component A with sub-components 1 and 2 in the upper panel of the figure) and another single component (B) separated in projection by ∼ 6 parsec. The estimated binary separation obtained from the double-peaked lines matched exactly with the VLBI data. The precession helices generated by the kinematic model match well with the GMRT and FIRST images at 325, 610 and 1400 M Hz (lower panel of the figure). The model indicates that either the jet precession is induced by torques in the primary accretion disc due to the secondary black hole in a non-coplanar orbit around the primary, or the jet may forced to precess under the Bardeen-Petterson effect. The authors also studied the host galaxy properties using SDSS i- and r-band data, finding that a combination of Sersic and exponential profiles are required to fit the optical light distribution of the galaxy. The disk component dominates beyond 2.5 kpc, whereas the inner portion is bulge-dominated. The extended disk-like sub-structure may represent a gas-rich, unequal-mass merger. The optical emission lines, the helical kpc-scale jets, the parsec-scale VLBI image, and the kinematic model all support the binary black holes scenario in this source.
Study of spider pulsar binary eclipses and discovery of an eclipse mechanism transition
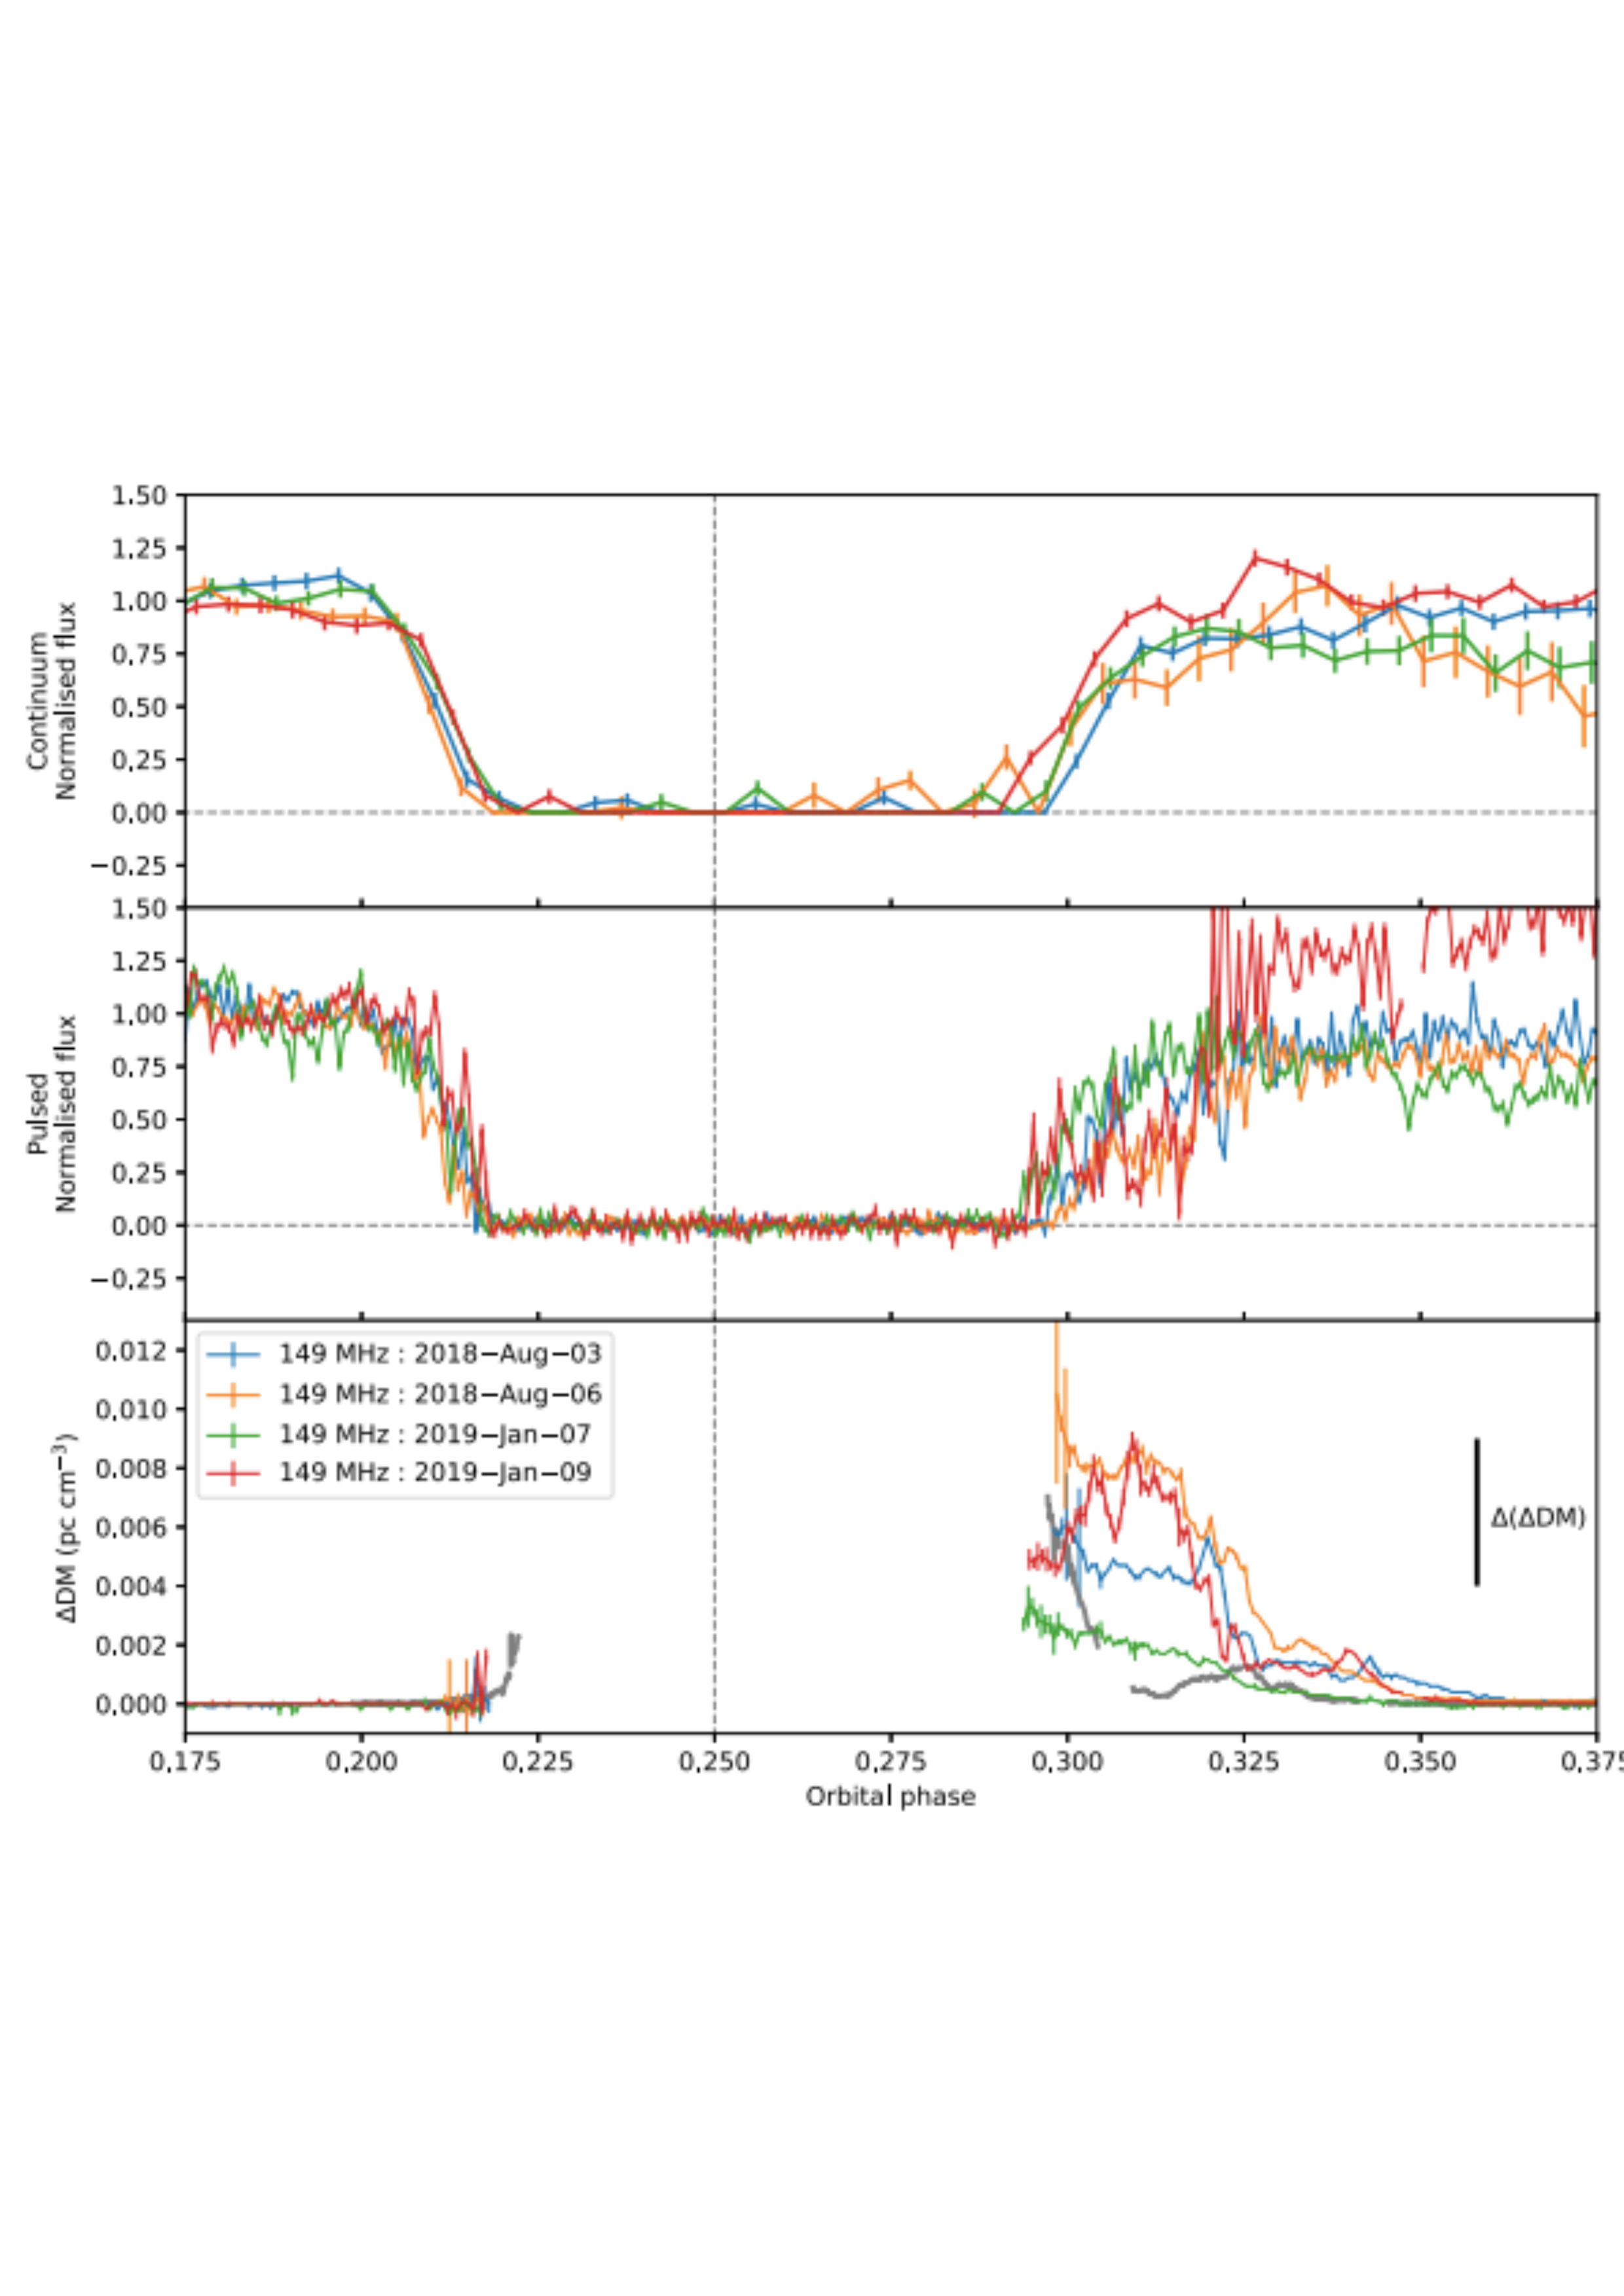
Spider pulsars are fast spinning millisecond pulsars (MSPs) in compact binaries with a low-mass companion. Polzin et al. present a study of the low-frequency eclipses of spider pulsars PSR B1957+20 and PSR J1816+4510 with the Low Frequency Array (LOFAR), the upgraded Giant Metrewave Radio Telescope (uGMRT), the Westerbork Synthesis Radio Telescope (WSRT) and the Parkes telescope. This dedicated campaign to simultaneously observe the pulsed and imaged continuum flux densities throughout the eclipses reveals many similarities between the excess material within the two binaries, independent of the companion star properties. Measurements of eclipse durations over a wide range of radio frequencies show a significant dependence of eclipse duration on frequency for both pulsars, with wider eclipses at lower frequencies. The results of the paper provide a marked improvement in the observational constraints available for theoretical studies of the eclipse mechanisms. The observations show that the pulsar fluxes are entirely removed throughout the main body of the eclipses. For PSR J1816 + 4510, Polzin et al. present the first direct evidence of an eclipse mechanism that transitions from one that removes the pulsar flux to one that merely smears out pulsations. The authors argue that this is a consequence of scattering in a tail of material flowing behind the companion. Contrary to the belief that evolution of such systems can ultimately explain formation of the isolated MSPs, the inferred mass-loss rates from the companion stars estimated in this study are found to be too low to evaporate the stars within a Hubble time. The figure presents measurements of the radio emission of PSR B1957+20 throughout the eclipse region.
Discovery and Timing of Three Millisecond Pulsars in Radio and Gamma-Rays with the Giant Metrewave Radio Telescope and Fermi Large Area Telescope
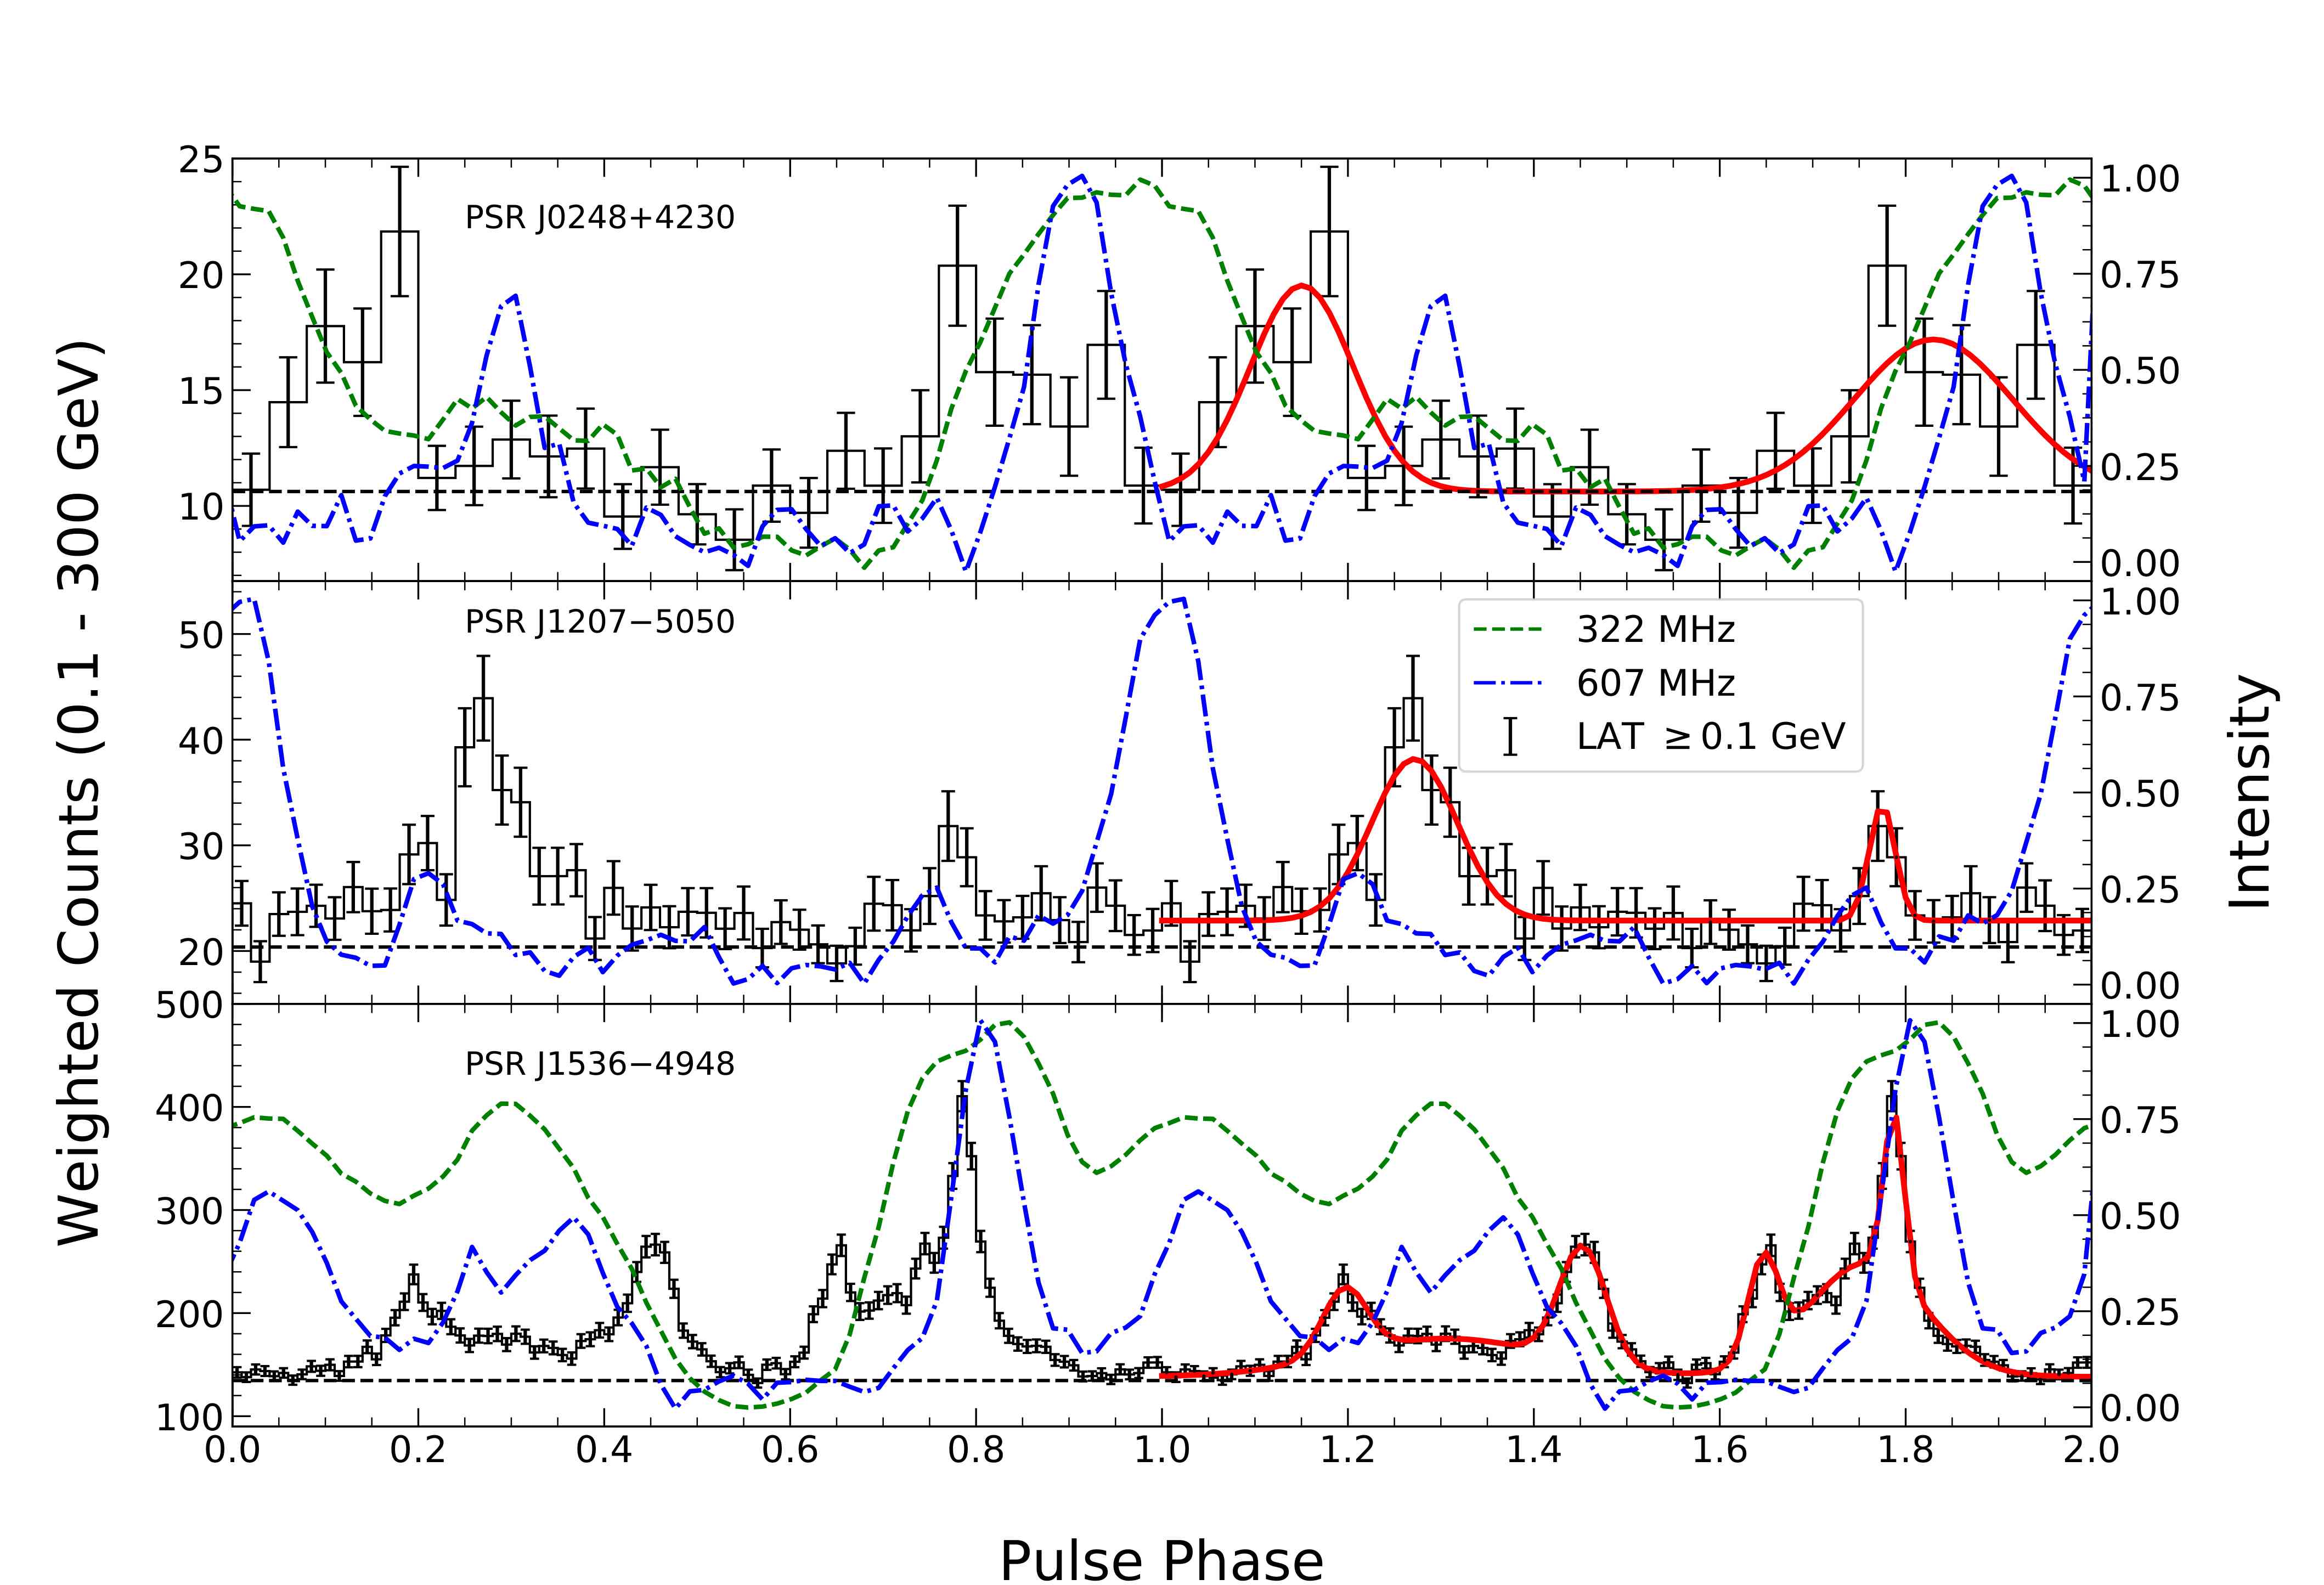
Millisecond pulsars (MSPs) are rapidly rotating neutron stars, from which we observe pulses having extremely stable rotational periodicity as the beams of radiation sweep across our line of sight. This makes MSPs the most accurate celestial clocks. Searching for pulsations of unknown MSPs in the gamma-ray band is extraordinarily computationally expensive due to the scarcity of photons, particularly in the case of binaries where the MSP revolves around its companion. While gamma-ray searches have been possible in a few cases, it is generally far more efficient to first search for radio pulsations in the direction of the gamma-ray sources, to identify the pulsar period. Bhattacharyya et al. used the Giant Metrewave Radio Telescope (GMRT) at 322 MHz and 607 MHz to search for radio pulsations in the directions of 375 unassociated Fermi Large Area Telescope (Fermi-LAT) gamma-ray sources. They identified three new MSPs, PSR J0248+4230, PSR J1207-5050 and PSR J1536-4948, named after their locations in the sky. After the discovery, the authors conducted regular timing follow-up observations for about 5 years with the GMRT to pin down the pulsar periods, period derivatives, sky positions, and parameters related to the pulsars orbits. They then folded the gamma-ray photons from the three MSPs from the Fermi-LAT data with the parameters derived from the GMRT observations, resulting in the detection of gamma-ray pulsations as well. They find that PSR J0248+4230 and PSR J1207-5050 are isolated MSPs, with periods of 2.60 milliseconds and 4.84 milliseconds. PSR J1536-4948 has a period of 3.07 milliseconds, and is in a binary system with an orbital period of about 62 days about a star whose mass is approximately 1/3rd that of the Sun. PSR J1536-4948 is an unusual MSP with an extremely wide pulse profile in both radio and gamma-rays, a pattern not generally seen in such pulsars. Bhattacharyya et al. examined the pulsar emission models and emission geometries that could account for the observed radio and gamma-ray pulsed emission. PSR J1536-4948 is very bright in gamma-ray, allowing the authors to count every photon emitted from the source from the lowest to the highest energy band of the gamma-ray spectrum, at an accuracy of 1 part in a million. In addition, PSR J1536-4948 shows evidence for very high energy emission (at energies higher than 25 GeV), which is very rare for millisecond pulsars. The figure shows the pulse profiles of the 3 MSPs from the GMRT and Fermi-LAT observations.
Propagation Effects in Quiet Sun Observations at Metre Wavelengths
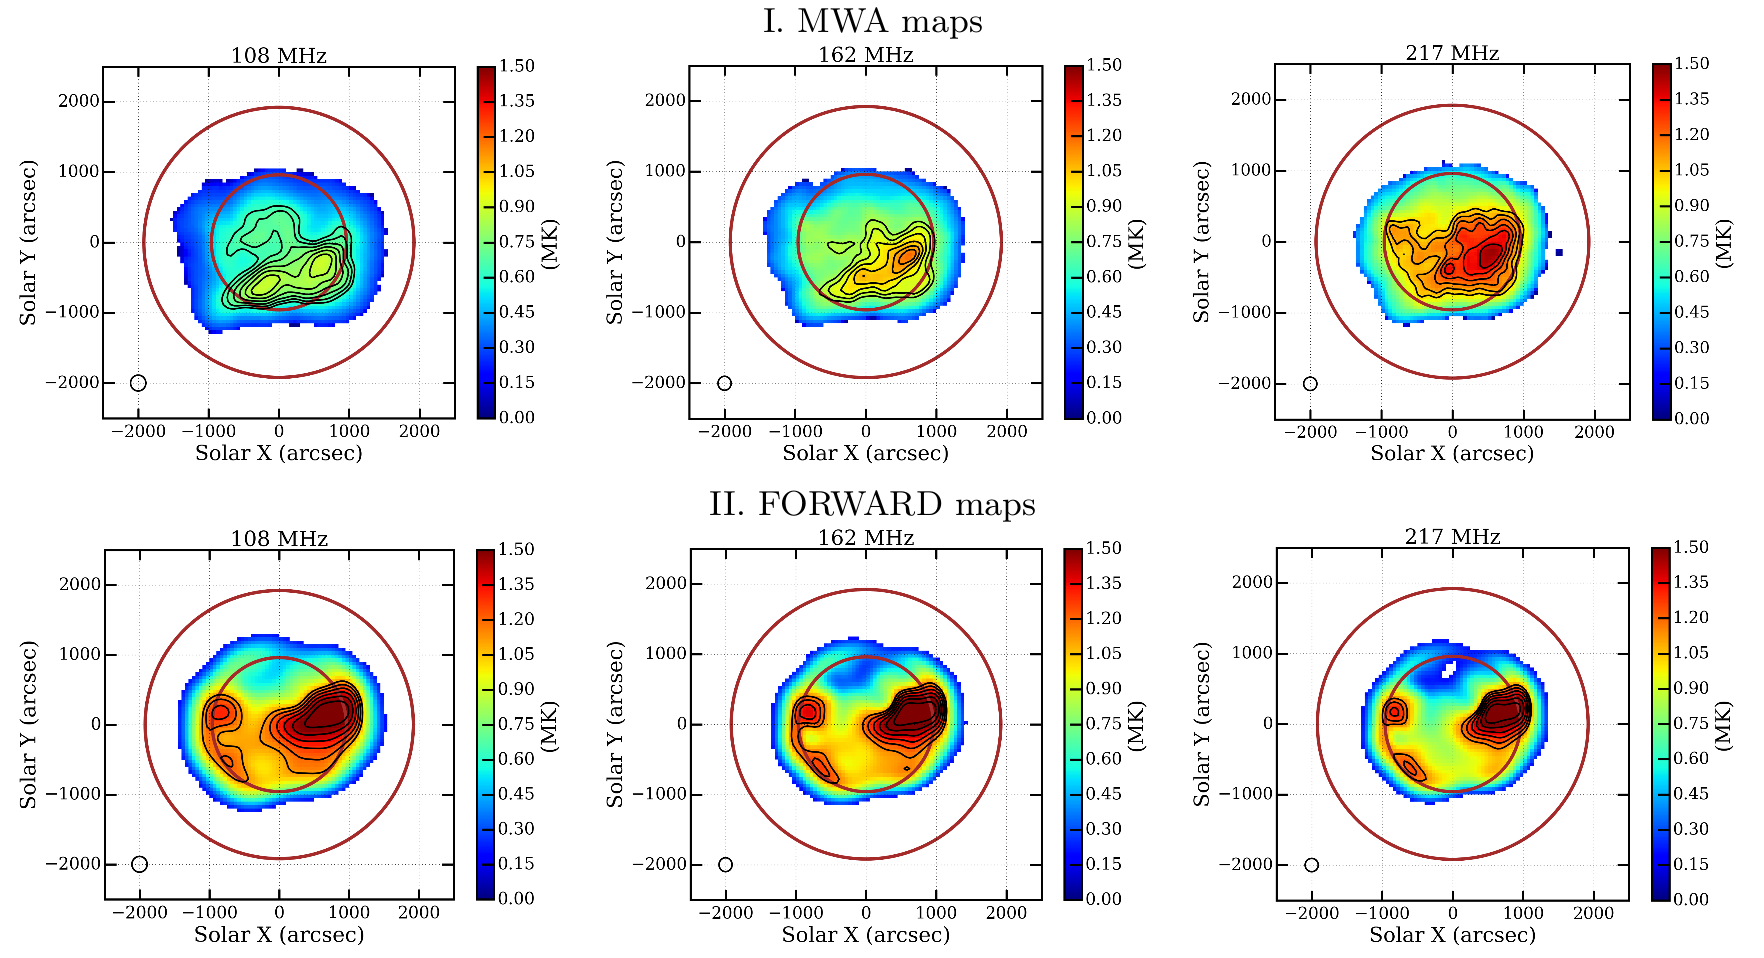
Metrewave emission from the quiet sun arises from thermal bremsstrahlung in the million-degree Kelvin (MK) corona, and can potentially be a rich source of coronal diagnostics. On its way to the observer, the radiation gets modified substantially due to the propagation effects – primarily refraction and scattering – as it traverses the magnetised and turbulent coronal medium, leading to a redistribution of the intensity in the image plane. By comparing high-fidelity full-disk metrewave solar maps during a quiet solar period and the corresponding modelled thermal bremsstrahlung emission, Sharma and Oberoi explore a novel approach to characterise and quantify these propagation effects. The solar radio maps between 100 and 240 MHz come from the Murchison Widefield Array (MWA). The FORWARD package, which does not include propagation effects, is used to simulate thermal bremsstrahlung images using the self-consistent Magnetohydrodynamic Algorithm outside a Sphere coronal model (Gibson et al., 2016). The authors attribute the differences between the observed and modelled maps to scattering and refraction. A good general correspondence between the modelled and observed brightness distributions is seen, though significant differences are also observed. The observed radio size of the Sun is found to be 25–30% larger in area. The emission peak corresponding to the only visible active region shifts by 8’–11’ and its size increases by 35–40%. Interestingly the direction of this shift is closer to the tangential direction than the radial direction, providing evidence for significant anisotropic propagation effects. Simple models suggest that the fraction of scattered flux density is always larger than a few tens of percent, and varies significantly between different regions (active and quiet regions, and coronal holes). Sharma and Oberoi estimate coronal density inhomogeneities to lie in the range 1–10%. In the figure, the top row shows the MWA maps and the bottom row those obtained using FORWARD. Only regions with brightness temperature > 0.2 MK are shown. Contour levels in all the maps are 70, 75, 80, 85, 90 and 95% of the peak. The authors also find that the flux densities estimated by the MWA and FORWARD are in excellent agreement at frequencies above 200 MHz, but, curiously, the MWA flux densities are systematically lower at lower frequencies. A likely reason is that the measurements used by FORWARD progressively lose accuracy with increasing height, where the emission at lower frequencies arises.
Supernova Interaction with a Dense Detached Shell in SN 2001em
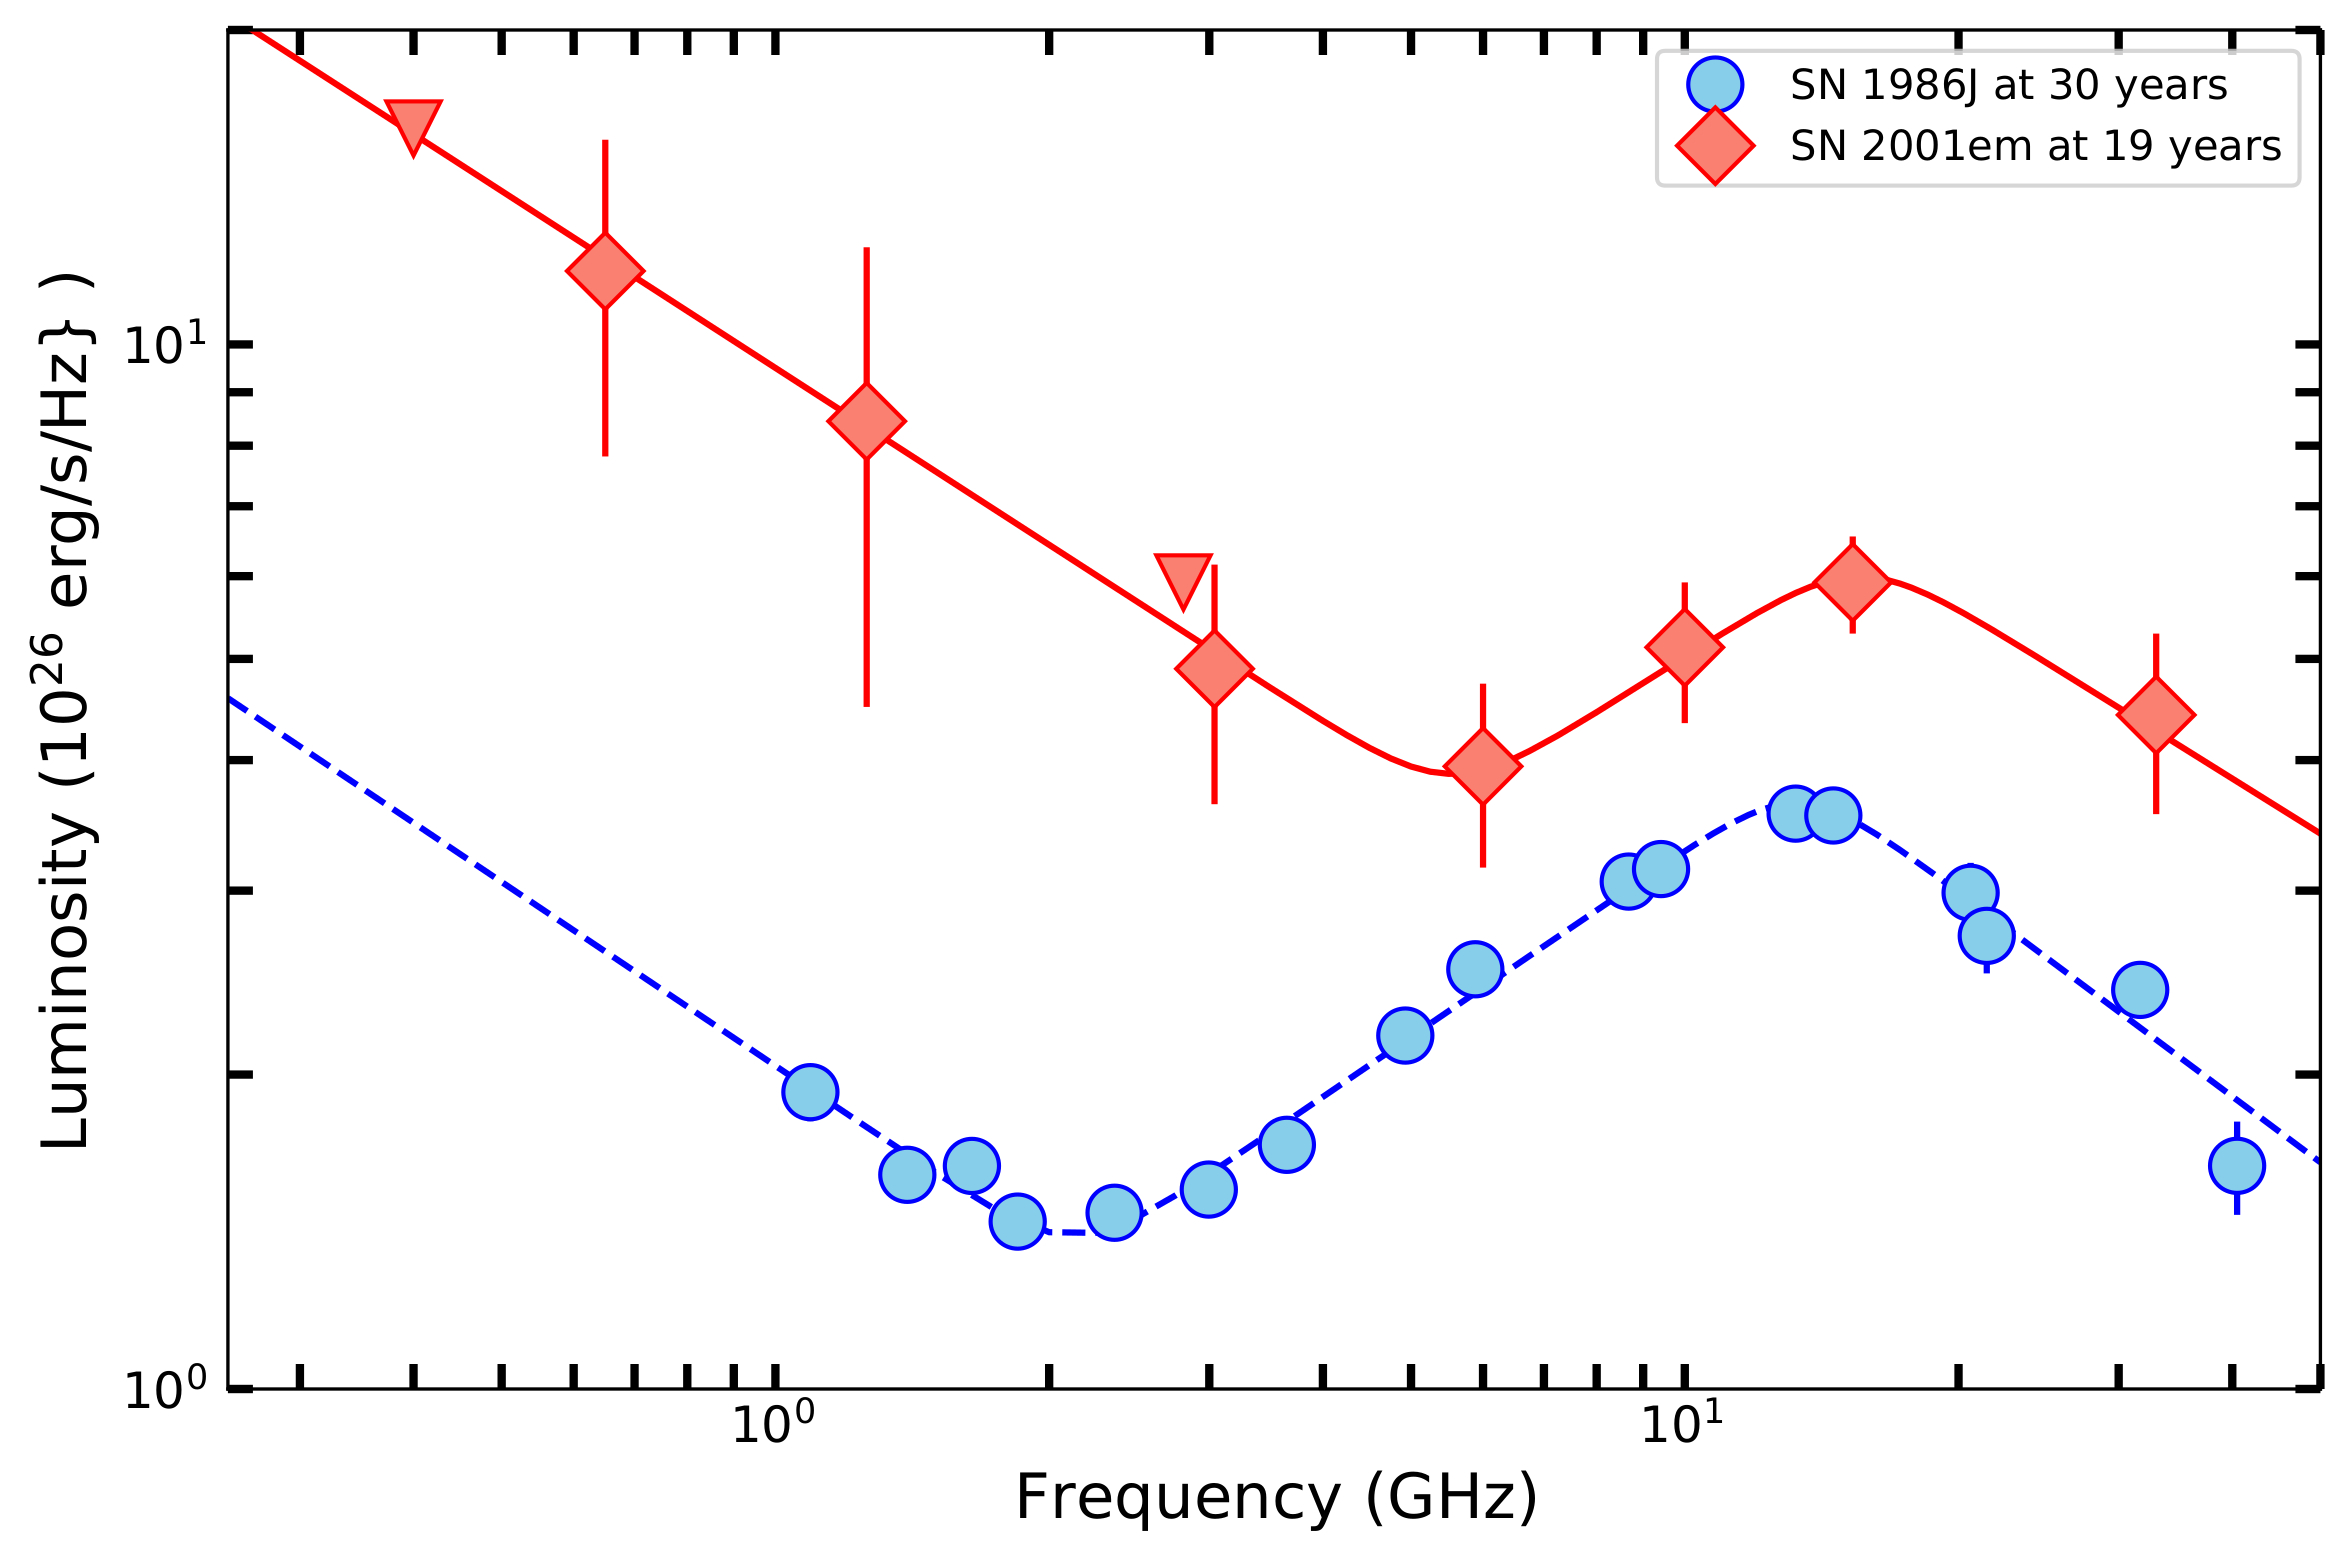
Chandra et al. carried out  a comprehensive analysis of supernova SN 2001em covering a period of 19 years since its discovery. SN 2001em is the oldest supernova known to have undergone a metamorphosis from a stripped envelope, with no hydrogen or helium, to an interacting supernova (with late time presence of hydrogen). An early spectrum indicates that it exploded as a Type Ib supernova. Later, the ejecta caught up with a dense circumstellar hydrogen-shell, ejected a few thousand years before the explosion, triggering interaction between the supernova ejecta and the dense shell, producing radio, X-ray, and hydrogen-alpha emission. Chandra et al. used data from the Very Large Array in radio bands and from Chandra, XMM-Newton, and Swift-XRT in the X-ray bands, along with the hydrogen-alpha measurements. They combined these data with their low radio frequency measurements with the Giant Metrewave Radio Telescope at two epochs covering three frequencies. While the observations missed the phase when the shock entered the dense shell, the X-rays indicate that the shock came out of the dense shell at around 1750 days. One of the most interesting features is revealed in the radio data, which show a spectral inversion at late epochs (more than 5000 days after the explosion) at around 3 GHz, which mimics the properties of the central absorbed component seen in SN 1986J. A possible explanation for this component is that the progenitor of SN 2001em was a massive binary system that underwent a period of common-envelope evolution. The hydrogen envelope from the progenitor of SN 2001em may have been lost as a result of binary interaction. SN 2001em is the only other supernova after SN 1986J in which this kind of spectral inversion is seen. The figure shows a comparison of the late time radio spectrum of SN 2001em at approximately 19 years after the explosion with that of SN 1986J at approximately 30 yrs; the latter shows the presence of a central component at late times. This is one of the most direct pieces of evidence of common-envelope evolution causing asphericity in the explosion environment.
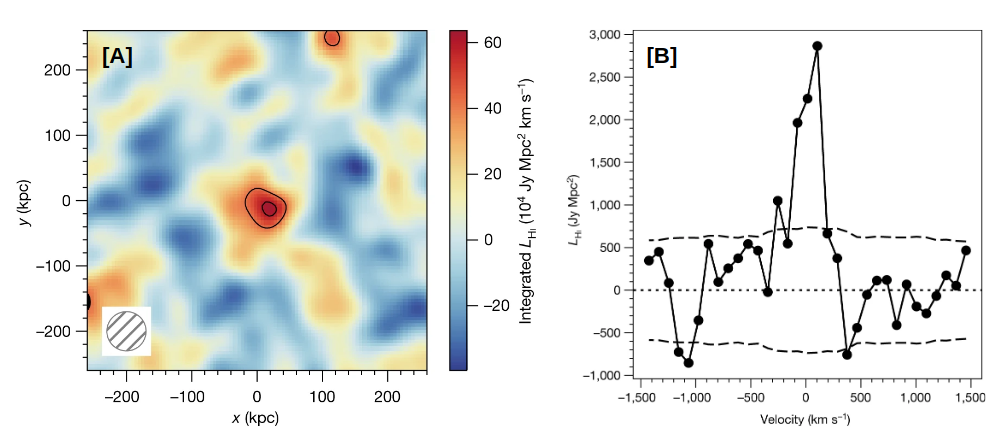
HI 21-centimetre emission from an ensemble of galaxies at an average redshift of one
Baryonic processes in galaxy evolution include the infall of gas onto galaxies to form neutral atomic hydrogen (HI), which is then converted to the molecular state (H2), and, finally, the conversion of H2 to stars. Understanding galaxy evolution thus requires an understanding of the evolution of stars and of neutral atomic and molecular hydrogen. For the stars, the cosmic star-formation rate density is known to peak at redshifts between 1 and 3, and to decline by an order of magnitude over the subsequent 8 billion years; the causes of this decline are not known. For the gas, the weakness of the hyperfine transition of HI at 21 cm wavelength — the main tracer of the HI content of galaxies—means that it has not hitherto been possible to measure the atomic gas mass of galaxies at redshifts higher than about 0.4; this is a critical gap in our understanding of galaxy evolution. Chowdhury et. al. report a measurement of the average HI mass of star-forming galaxies at a redshift of about one, obtained by stacking the HI 21 cm emission signals from 7,653 galaxies over a 1.2 square degree region of the sky. The figure shows [A] the stacked HI 21 cm emission map and [B] the stacked HI 21 cm emission spectrum; the detection of the average 21cm emission signal can be clearly seen in both panels. The measured average HI mass of the sample of galaxies at z~1 is similar to the average stellar mass of the sample but the HI mass can fuel the observed star-formation rates for only 1 to 2 billion years in the absence of fresh gas infall. This suggests that gas accretion onto galaxies at redshifts of less than one may have been insufficient to sustain high star-formation rates in star-forming galaxies. This is likely to be the cause of the decline in the cosmic star-formation rate density at redshifts below one.