Main Sequence of Star-forming galaxies
1) Star formation rate (SFR) and stellar mass are fundamental physical properties of galaxies.
2) For star-forming (SF) galaxies these are correlated with each other, termed as main sequence (MS).
 Renzini & Peng 2015
Main Sequence of Star-forming galaxies
1) Existence of the MS is confirmed by several studies all the way upto redshifts of ~2 (Daddi et al. 2007, Elbaz et al. 2007 & Noeske et al. 2007).
2) Recent studies show the correlation all the way upto redshift of 4 (Peng et al. 2010).
3) The slope and dispersion remains nearly constant with redshift.
4) If galaxies are selected in an SFR-limited fashion, no appreciable MS is recovered. See for e.g. Erb et al. 2006 (UV selected sample), Lee et al. 2013 (IR selected sample).
5) A two-color dependent criteria (e.g. BzK or UVJ two-color selection) is another selection criteria.
6) Basically these criteria cutout galaxies with low specific SFR (sSFR).
7) If massive galaxies with low SFR are termed as “star forming”, then the slope of the MS flattens.
8) Different criteria makes comparing results from different group difficult.
Main Sequence
1) The mere existence of MS indicates that the growth of galaxies is ordered as opposed to stochastic.
2) The absolute value of sSFR sets the clock of galaxy evolution.
3) The relation between MS and the specific rate of mass increase of the dark matter halos (proxy of gas inflow rate) is interesting.
4) SFR distance from the MS can be used to identify starburst galaxies and galaxies in transition towards quenching.
Need for an objective definition
1) Main sequence (MS) of star-forming (SF) galaxies plays a fundamental role in driving galaxy evolution.
2) Different studies find differences in normalization, slope and shape of the MS.
3) Different selection criteria for SF galaxies is the main reason for these discrepancies.
4) An objective definition of the main sequence that does not rely on any pre-selection of SF galaxies is required.
5) If generally adopted one can compare results from different group using the same star formation rate (SFR) and stellar mass diagnostics.
6) And/Or it will also highlight the relative systematics of different diagnostics.
7) It can also provide a more objective criterion for identifying quenching galaxies.
Galaxy Sample
1) Galaxies selected from SDSS DR7 release having reliable spectroscopic redshift.
2) AGNs were excluded thus reducing the sample to ~240,000 galaxies.
3) SFRs estimated from H-alpha flux and stellar masses from SED fits as in Brinchmann et al. 2004 (exception that their work was from SDSS DR4).
4) Galaxies were weighted by the V/V_max method.
 Renzini & Peng 2015
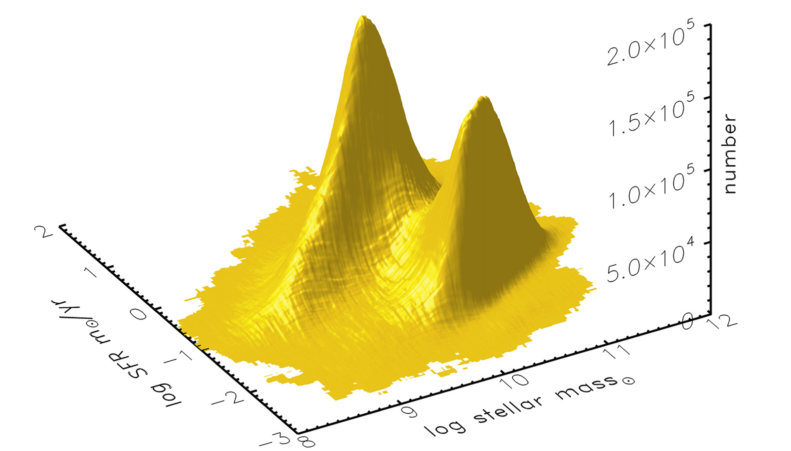
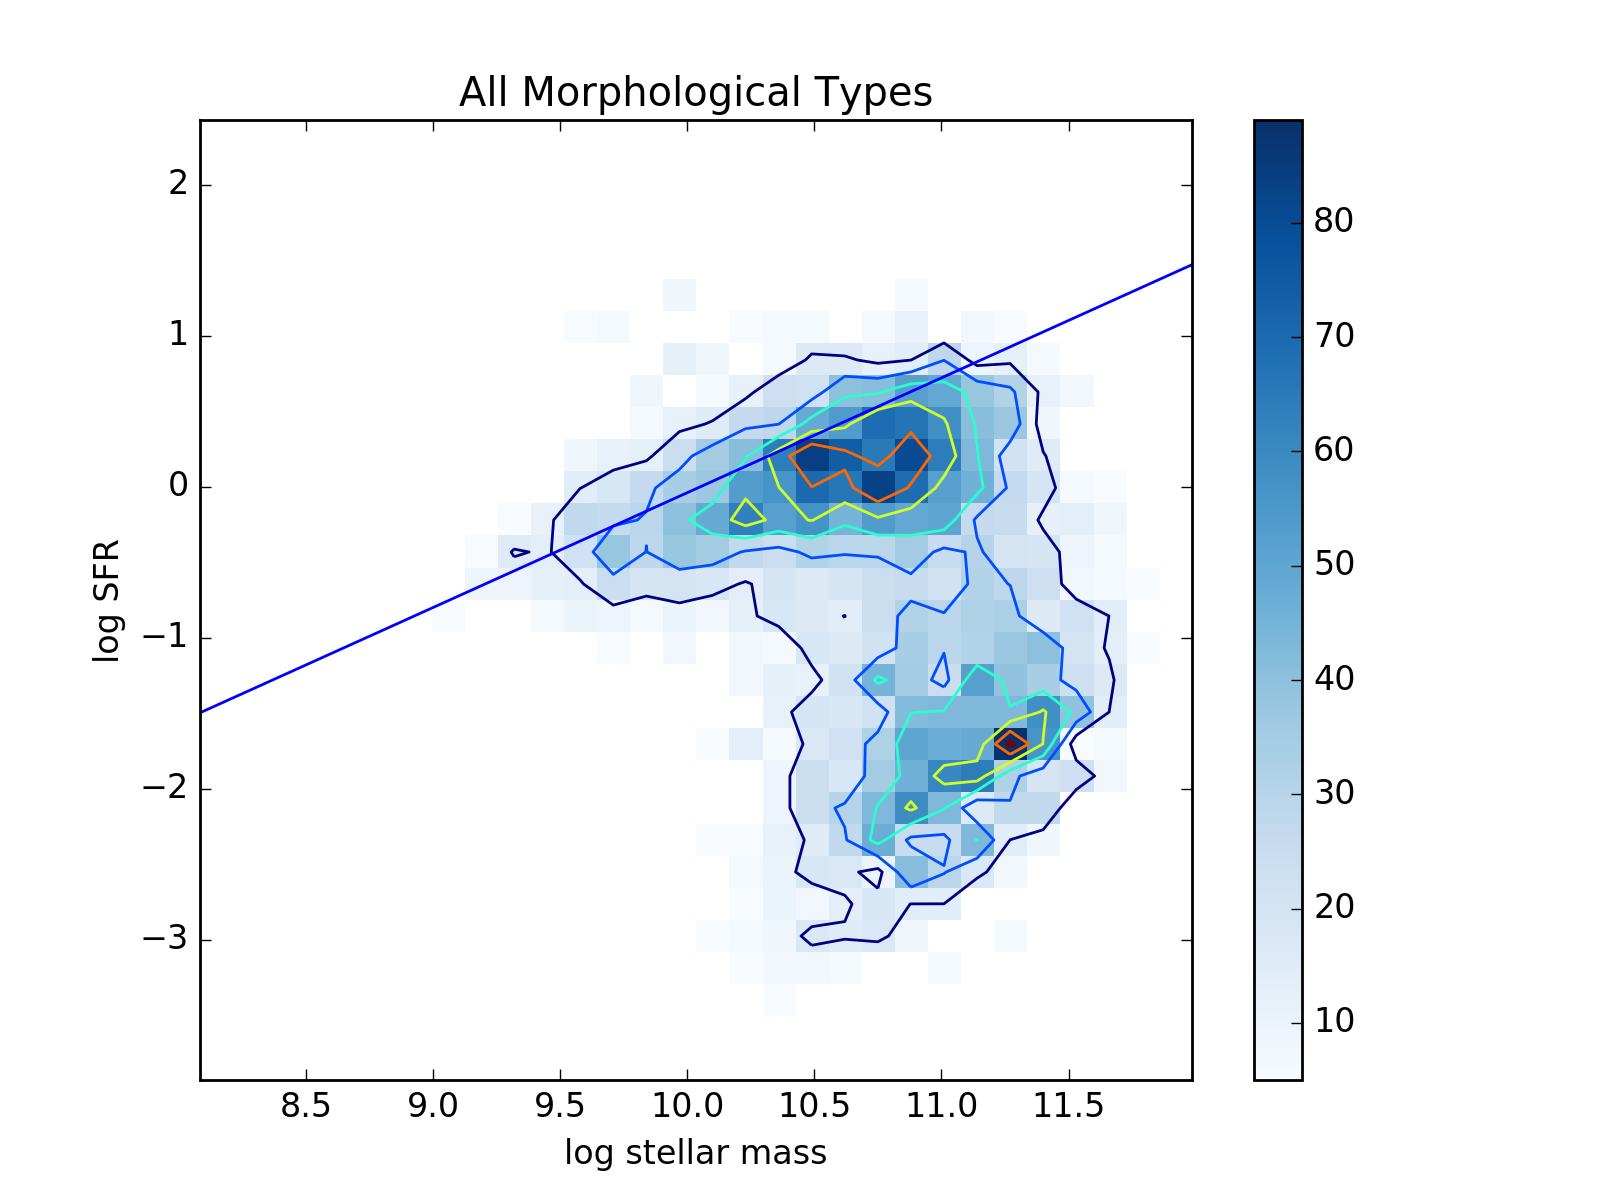
Two-way traffic in the green valley
1) The two peaks correspond to actively SF galaxies on the west, and quenched galaxies on the east.
2) The saddle includes a mixture of galaxies.
3) Coming from the SF peak to low SFR as an excursion (negative feedback from AGN?).
4) Others in a temporary excursion from the quenched peak (minor gas rich accretion).
5) Majority flow from SF to the quenched peak.
6) This is because the number of quenched galaxies increases from high to low z.
Star forming peak
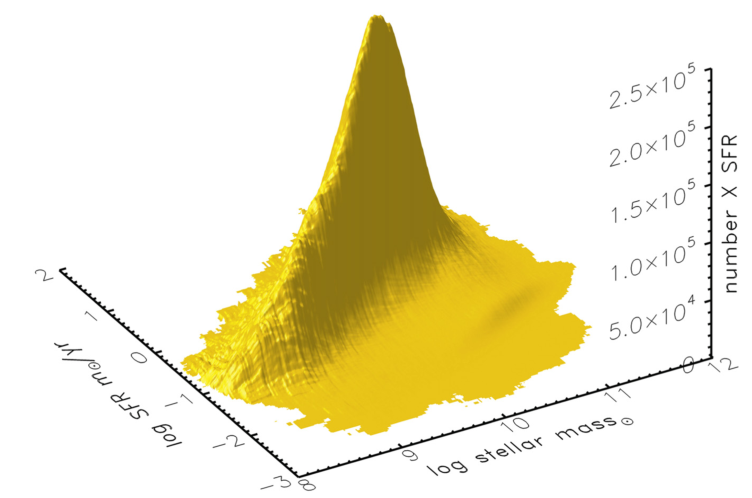 Renzini & Peng 2015
Quenched peak
1) Most of the mass contained in quenched galaxies and bulges.
2) Green valley also contribute to the mass, but not as much to SFR.
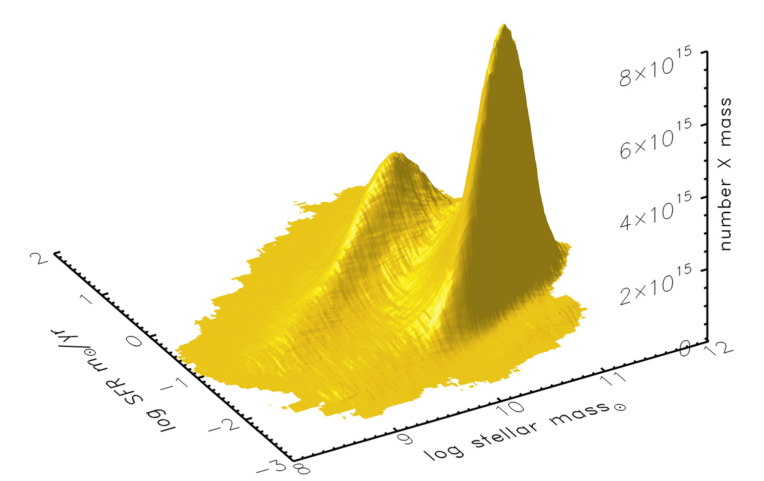 Renzini & Peng 2015
Objective MS definition
1) Median or average SFR (at a fixed stellar mass) might be more accurate but it depends on a pre-selection of galaxies.
2) Ridge line (corresponds to the mode) does not require any such pre-selection
3) The best fit straight-line to the ridge line (from number plot) is
log(SFR) = (0.76 \pm 0.01)log(M_*/M_sun) - 7.64 \pm 0.02.
4) Ridge line is linear upto the highest stellar masses in the sample.
5) Whitaker et al. 2012 showed a bending of the MS given by the total mass being given by already quenched bulges, hence contributing mass but no
star formation.
6) They do not see this effect, even though bulges should be maximally developed in the local universe.
7) The increasing bulge fraction with galaxy mass may lead to a deviation from ~1 slope of the MS (Abramson et al. 2014).
Double Schechter mass function of quenched galaxies
Baldry et al. 2004, Peng et al. 2010, Renzini & Peng 2015
Features of quenched galaxies
1) High-mass peak is well separated from the SF galaxies.
2) Low-mass peak is instead connected in a continuous fashion to the MS (possibly many transition objects in between).
3) In the frame of Peng et al. 2010 high mass galaxies are mass-quenched and low-mass are environment-quenched.
4) High mass galaxies are quenched in the current universe, with very few in transition.
5) At low masses environment quenching is dominant at low redshifts following the growth of large scale structure.
Expectations at high-z
1) At z ~ 2:
    1) Mass quenching has started very rapidly.
    2) Environment quenching has barely started as overdensity contrast is still small.
    3) High mass peak already in place and growing rapidly.
    4) Whereas the low mass peak should be barely noticeable.
    5) Flow of galaxies in the green valley should be high at high masses
       and low at low masses.
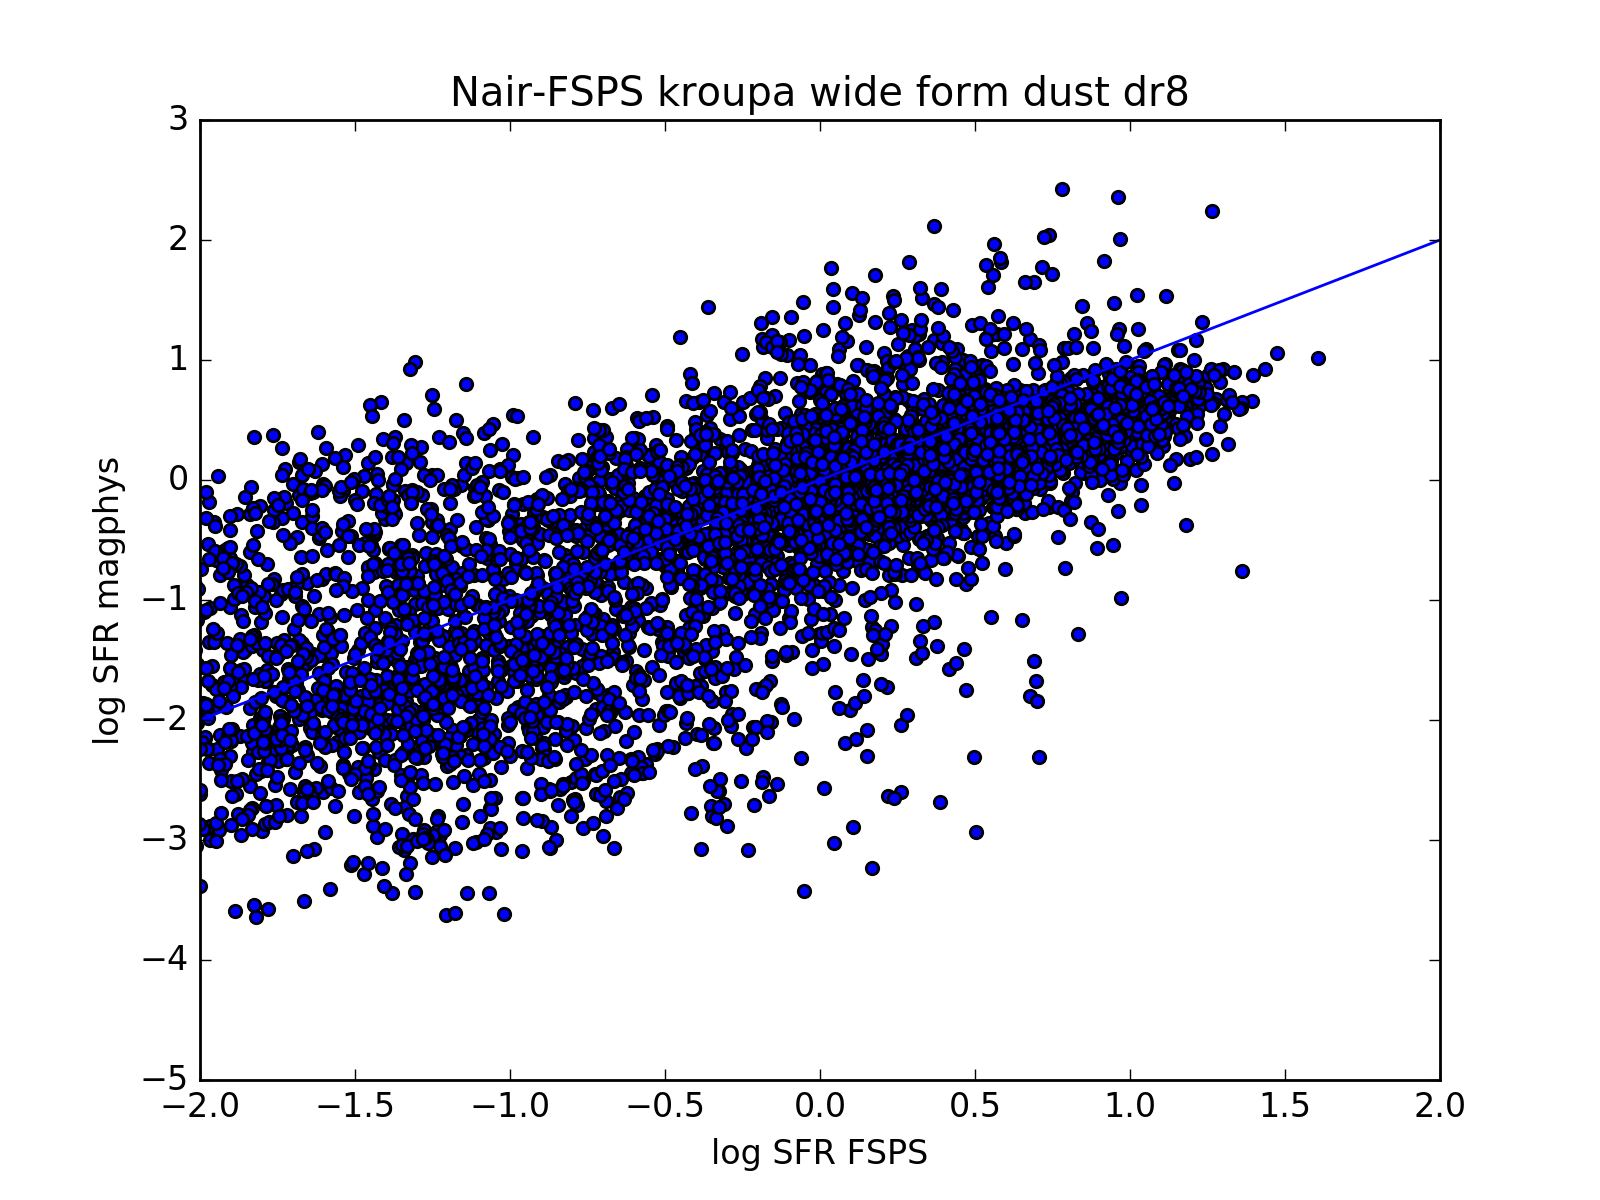
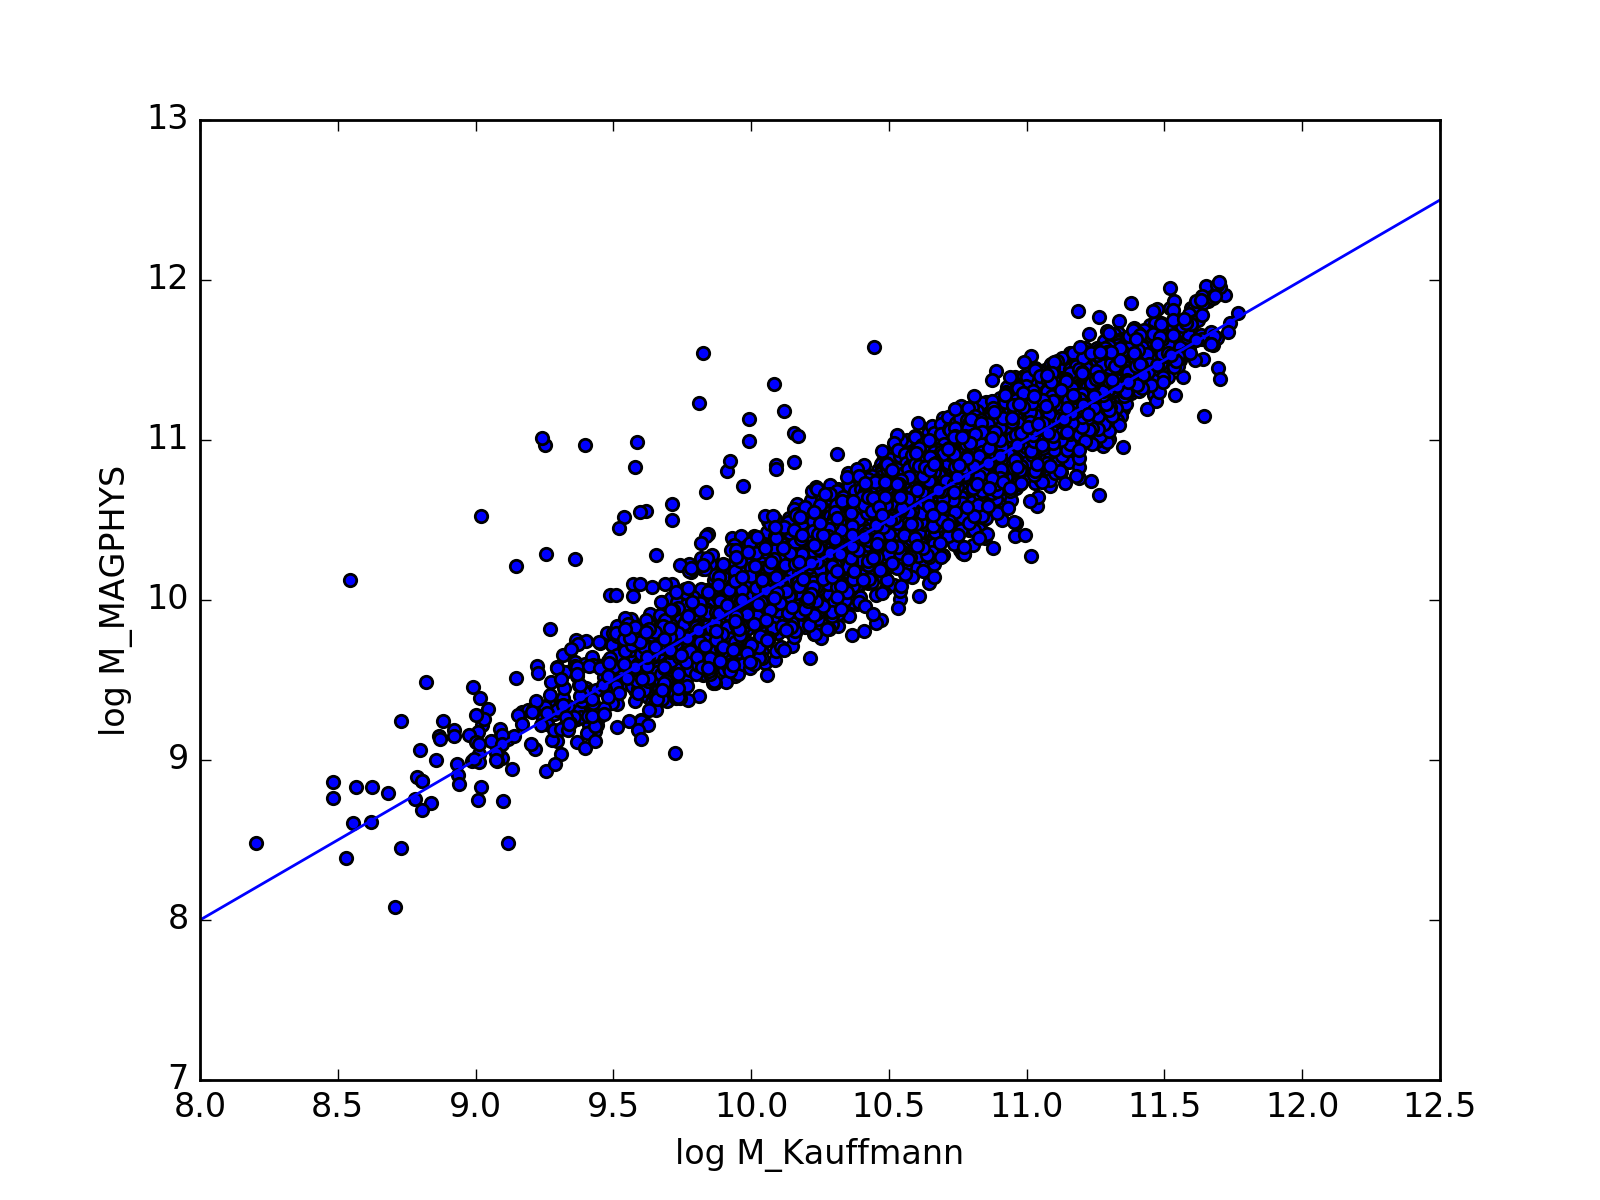
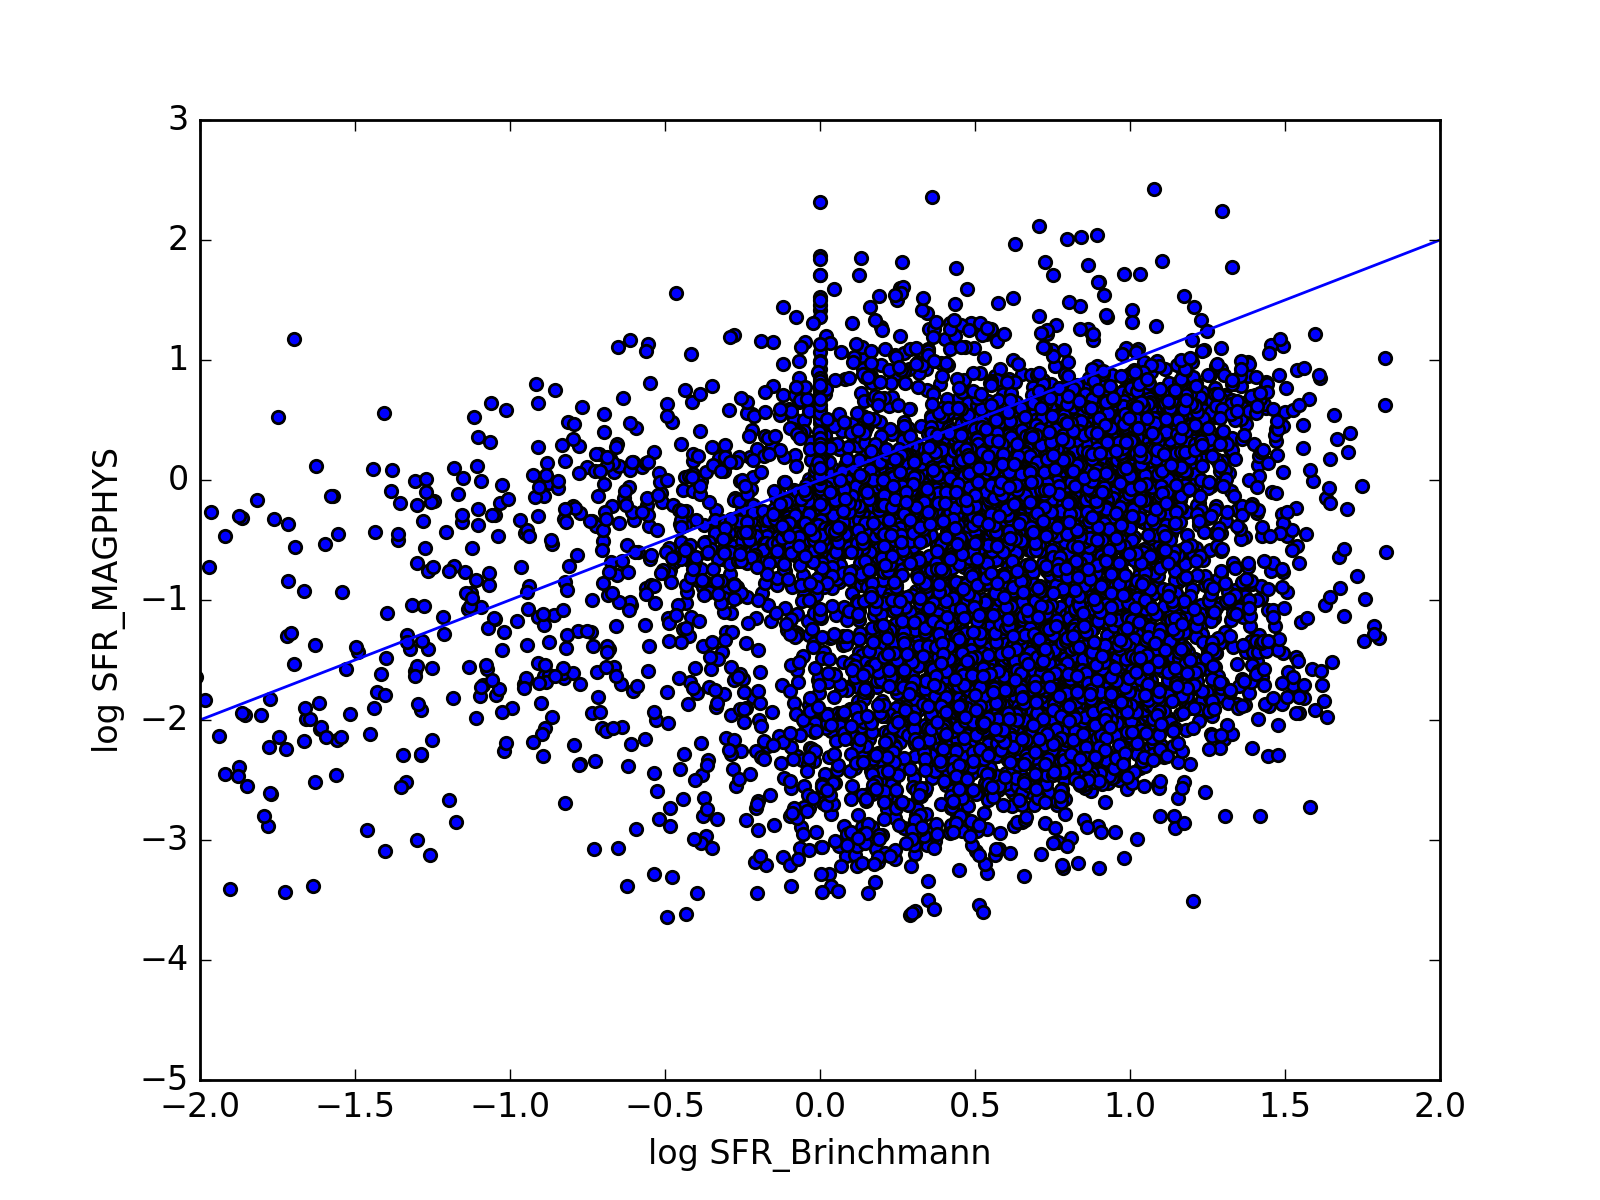
Comparison with Nair et al. sample
Comparison with Nair et al. sample
Nair et al. with FSPS DR8
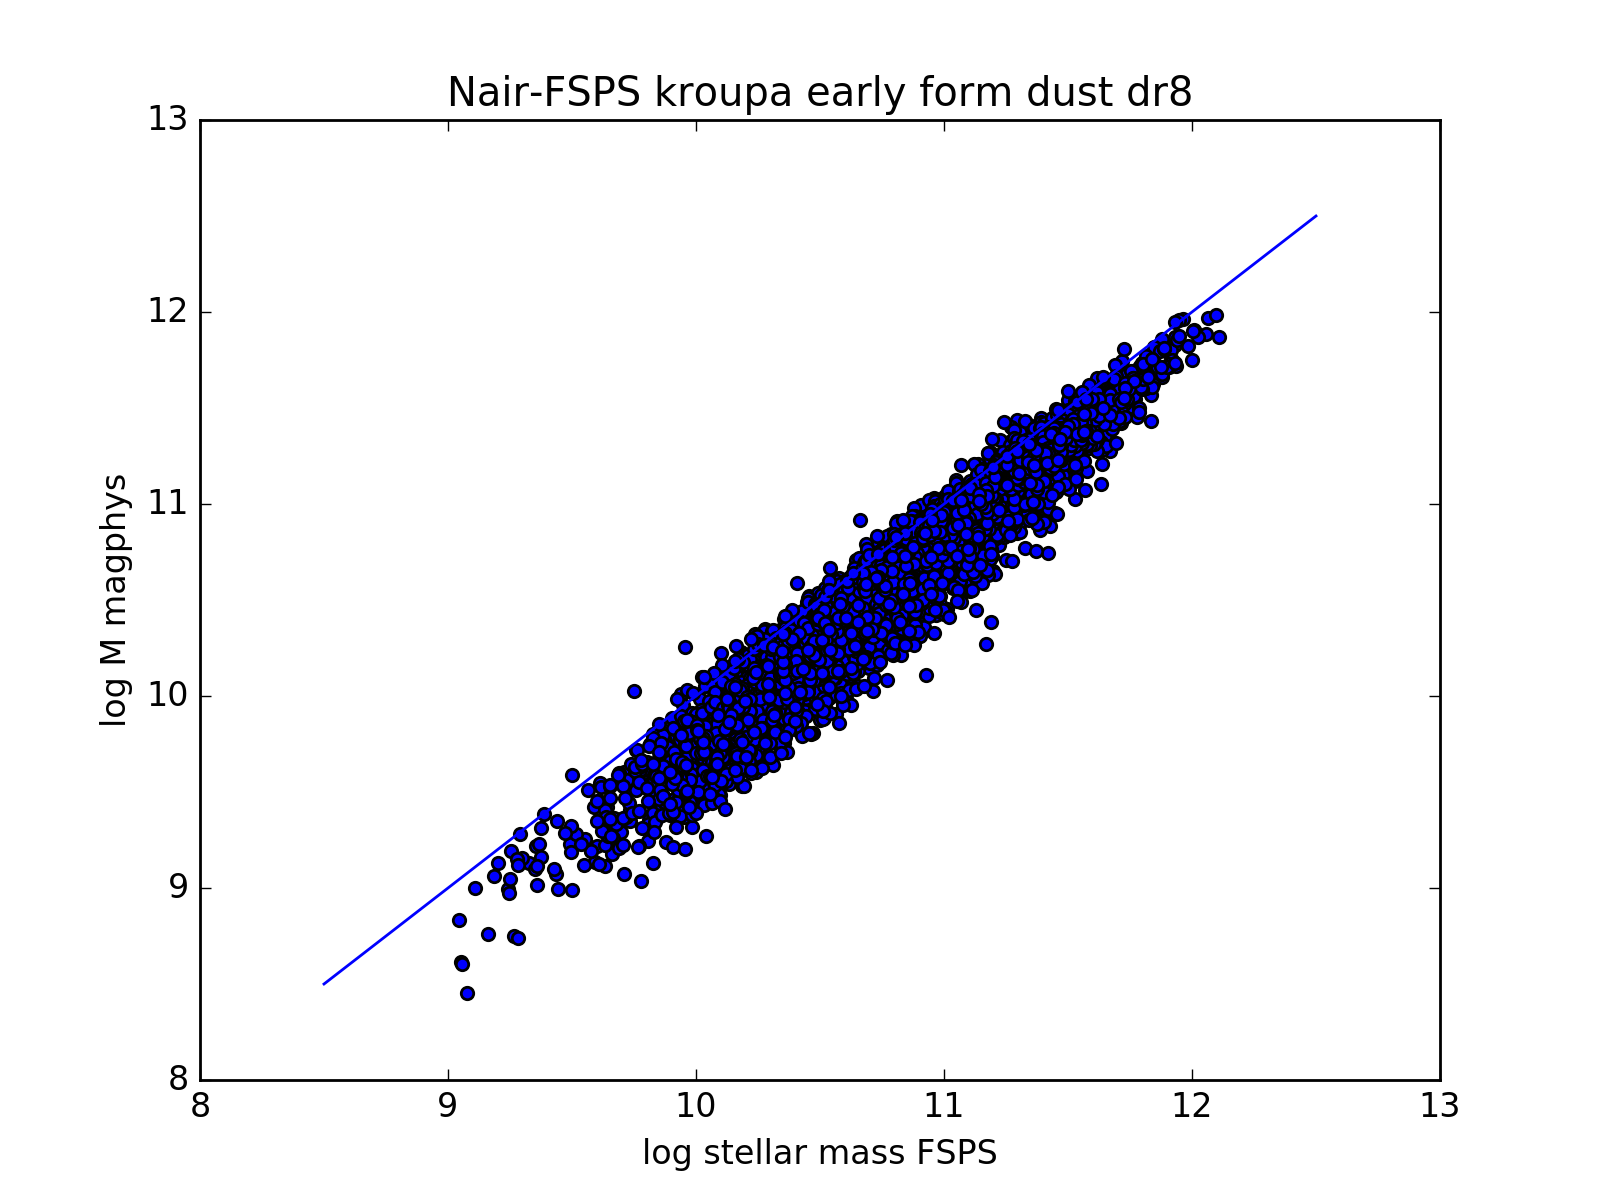
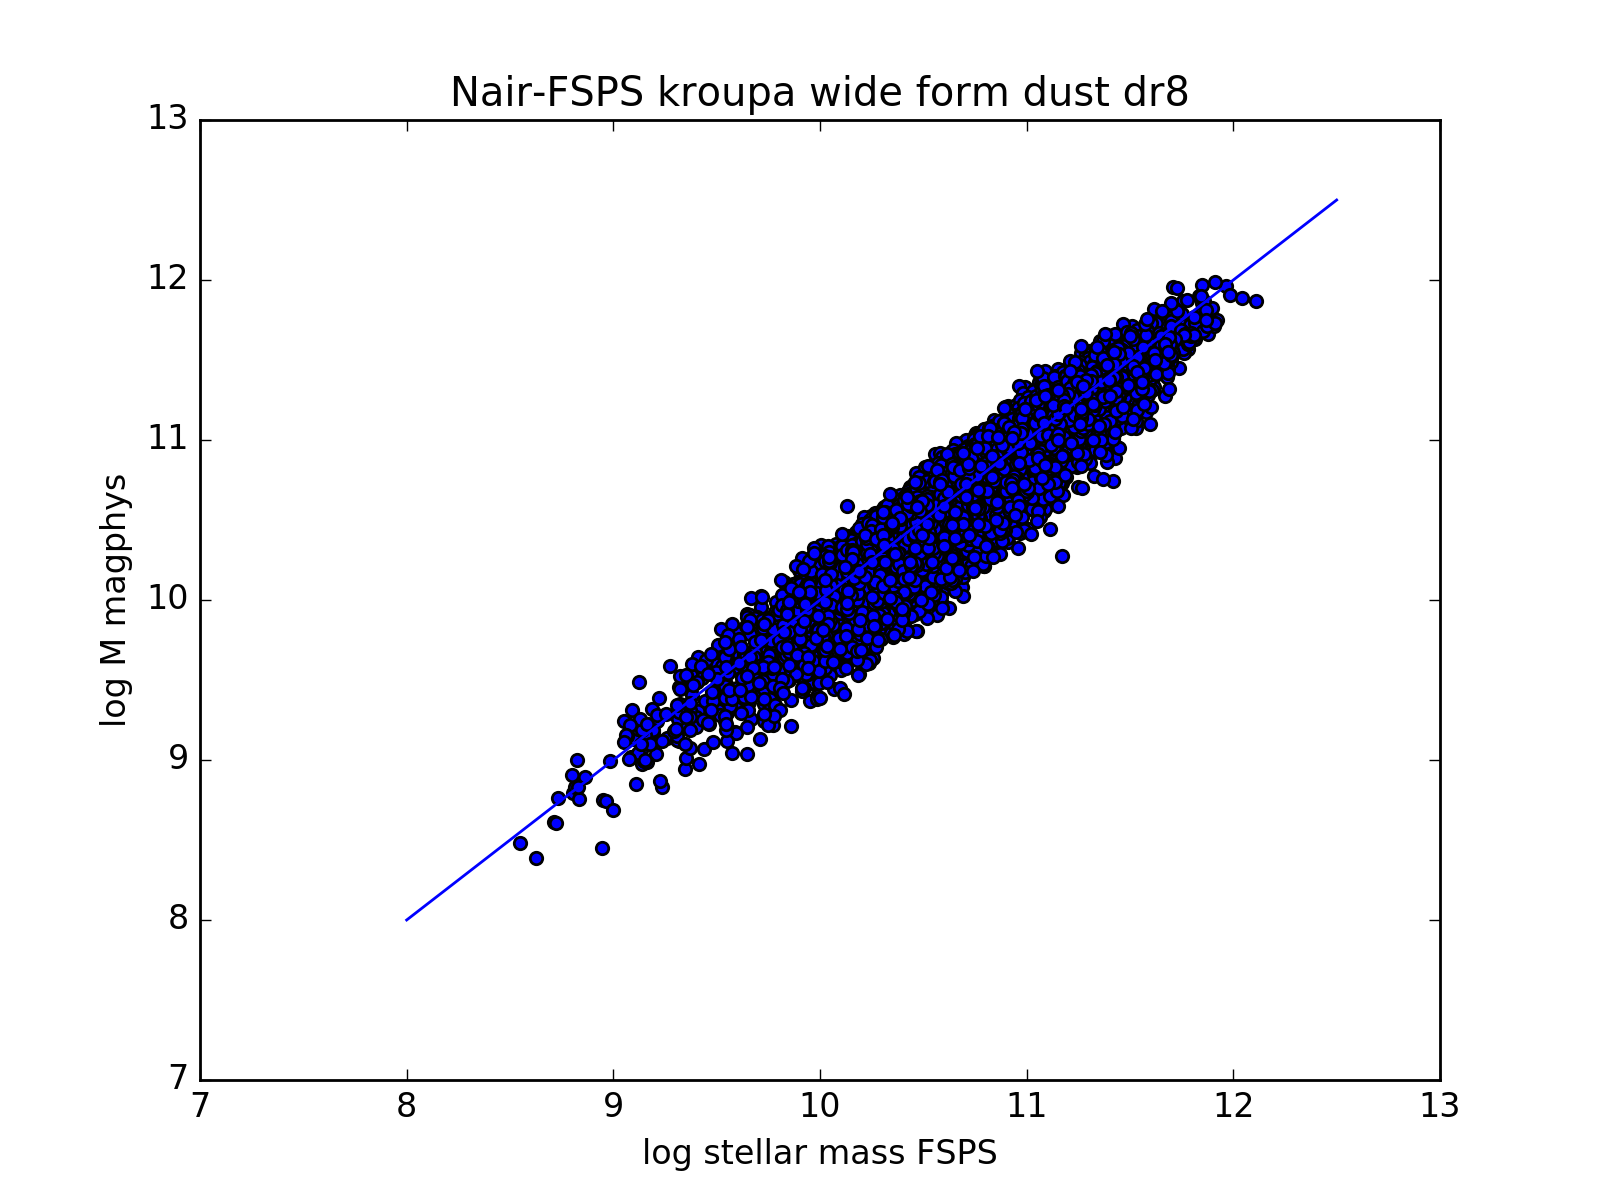
SFR: Nair et al. with FSPS DR8